The more I look at it, the more it seems drawing graphs in javascript+html is the only viable option to get anything decent and useful.
Gnuplot's graphs work, but they're not all that pleasant to look at. Same goes for the graphing tools I've seen in python. Mathematica, I'm told, does a very decent job, but I haven't used that much.
A big advantage for javascript graphing is shareability. Put up a github page, give people a link, voila. Everyone can see up to date graphs, often even interact with them.
The world of javascript graphs
Plenty graphing libraries exist for javascript ranging from extremeley simplistic to magnificently complex.
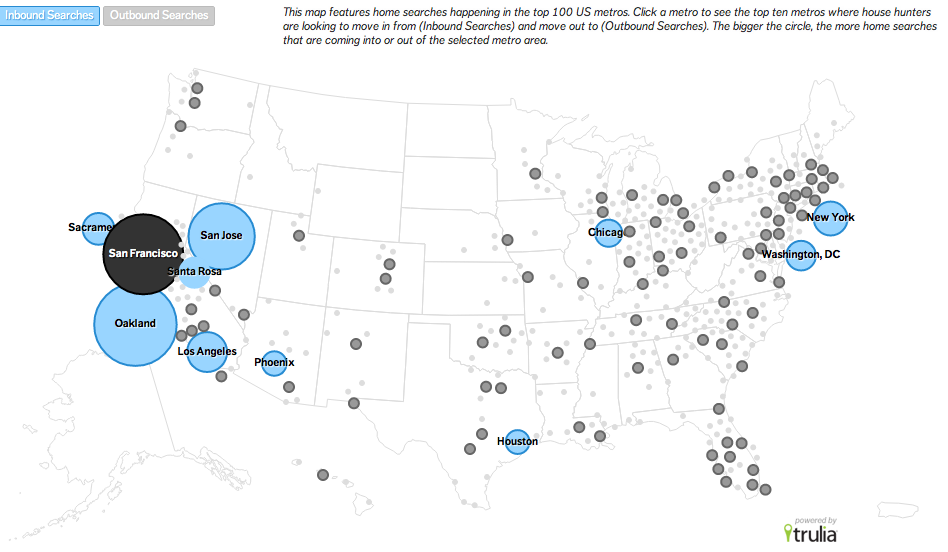
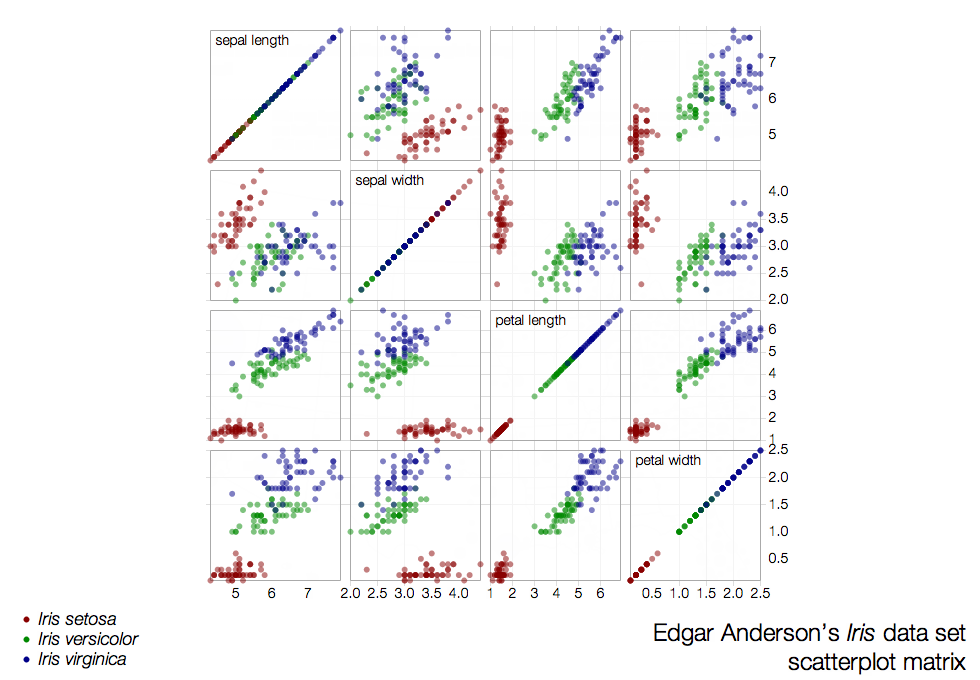
The most popular are probably d3.js and Raphael, both of which can get extremely complicated to use, but produce arguably the shiniest and most advanced data visualisations you can imagine.
Raphael is mostly a general vector library for the web. Appropriately beautiful as well.
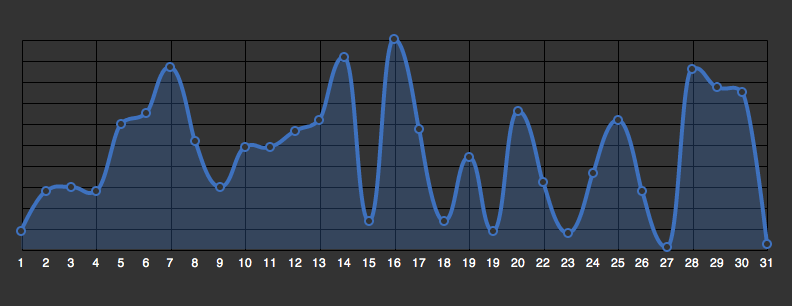
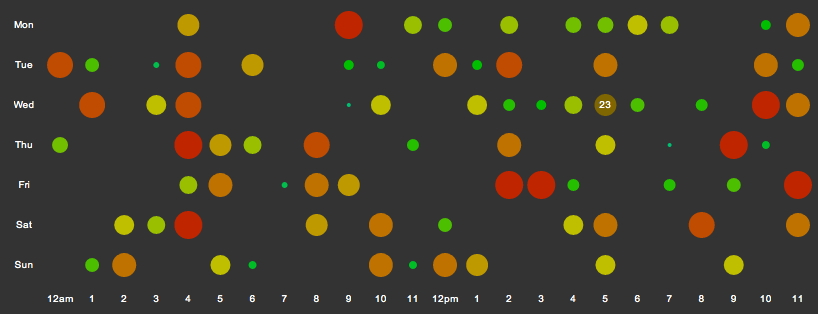
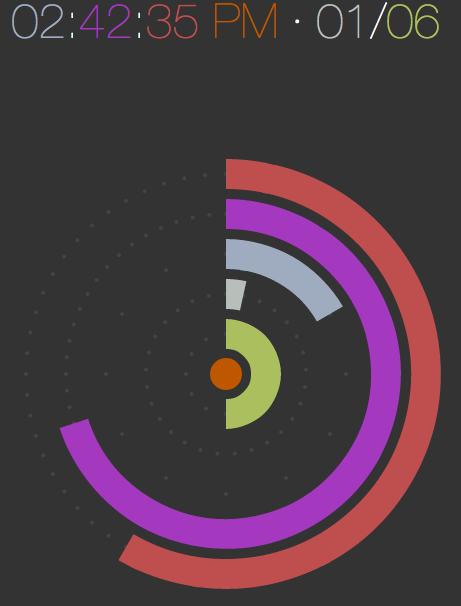
D3.js will make your life somewhat easier in that it's at least aimed specifically at making data visualisations, but there's plenty of rope to hang yourself with.
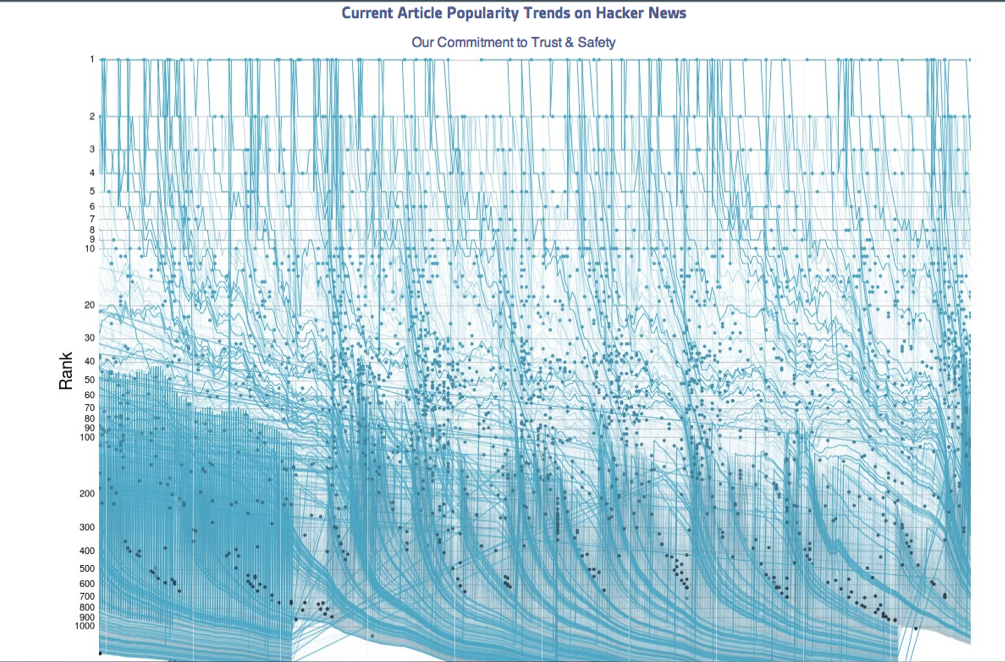
Flotr2
Those visualisations, while incredibly shiny, are difficult to make. It can take ages, trust me. I've tried and nothing I could come up with came even close. Most of all, using raphael and d3 is usually overkill - sometimes you just want a graph.
To visualize my past year of 750words I used Flotr2 - it took me ten minutes to go from parsed data dumps to shiny graphs. And that was because I had to come up with a javascript function to mangle my data into something Flotr2 will understand.
The best feature is that there isn't enough rope to hang yourself with. Nor does it make you want to over-engineer a simple graph.
Essentially, the code just sets up some data and a label or two:
function draw_time(container, data, title) {
var start = new Date(DATA[0].date).getTime(),
options,
graph,
i,
x,
o;
options = {
xaxis: {
mode: "time",
labelsAngle: 45,
},
selection: {
mode: "x",
},
legend: {
position: "se",
},
HtmlText: false,
title: title,
};
// Draw graph with default options, overwriting with passed options
function drawGraph(opts) {
// Clone the options, so the 'options' variable always keeps intact.
o = Flotr._.extend(Flotr._.clone(options), opts || {});
// Return a new graph.
return Flotr.draw(container, data, options);
}
graph = drawGraph();
Flotr.EventAdapter.observe(container, "flotr:select", function (area) {
// Draw selected area
graph = drawGraph({
xaxis: { min: area.x1, max: area.x2, mode: "time", labelsAngle: 45 },
yaxis: { min: area.y1, max: area.y2 },
});
});
// When graph is clicked, draw the graph with default area.
Flotr.EventAdapter.observe(container, "flotr:click", function () {
graph = drawGraph();
});
}
And what you get is a graph:
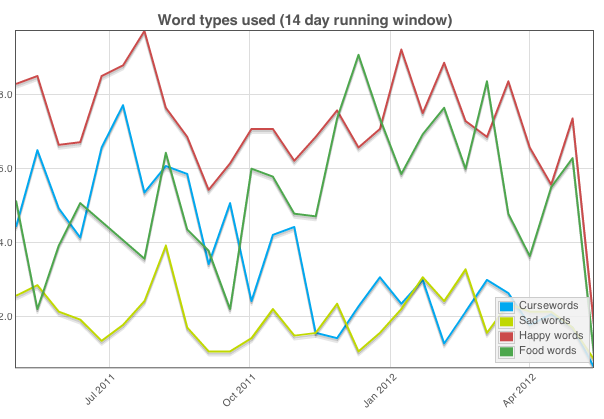
Love it.
Looks good. Serves its purpose. Simple to make.
Continue reading about Flotr2 - my favorite javascript graph library
Semantically similar articles hand-picked by GPT-4
- JavaScript’s most popular dataviz library
- Quick scatterplot tutorial for d3.js
- (ab)Using d3.js to make a Pong game
- Build responsive SVG layouts with react-svg-flexbox
- Sexy animated spirographs in 35 sloc of d3.js
Learned something new?
Read more Software Engineering Lessons from Production
I write articles with real insight into the career and skills of a modern software engineer. "Raw and honest from the heart!" as one reader described them. Fueled by lessons learned over 20 years of building production code for side-projects, small businesses, and hyper growth startups. Both successful and not.
Subscribe below 👇
Software Engineering Lessons from Production
Join Swizec's Newsletter and get insightful emails 💌 on mindsets, tactics, and technical skills for your career. Real lessons from building production software. No bullshit.
"Man, love your simple writing! Yours is the only newsletter I open and only blog that I give a fuck to read & scroll till the end. And wow always take away lessons with me. Inspiring! And very relatable. 👌"
Have a burning question that you think I can answer? Hit me up on twitter and I'll do my best.
Who am I and who do I help? I'm Swizec Teller and I turn coders into engineers with "Raw and honest from the heart!" writing. No bullshit. Real insights into the career and skills of a modern software engineer.
Want to become a true senior engineer? Take ownership, have autonomy, and be a force multiplier on your team. The Senior Engineer Mindset ebook can help 👉 swizec.com/senior-mindset. These are the shifts in mindset that unlocked my career.
Curious about Serverless and the modern backend? Check out Serverless Handbook, for frontend engineers 👉 ServerlessHandbook.dev
Want to Stop copy pasting D3 examples and create data visualizations of your own? Learn how to build scalable dataviz React components your whole team can understand with React for Data Visualization
Want to get my best emails on JavaScript, React, Serverless, Fullstack Web, or Indie Hacking? Check out swizec.com/collections
Did someone amazing share this letter with you? Wonderful! You can sign up for my weekly letters for software engineers on their path to greatness, here: swizec.com/blog
Want to brush up on your modern JavaScript syntax? Check out my interactive cheatsheet: es6cheatsheet.com
By the way, just in case no one has told you it yet today: I love and appreciate you for who you are ❤️
