After a year, my first business diary retires
This week last year, I started a business diary. Spurred on by the success of React+d3js, it was time to get serious.
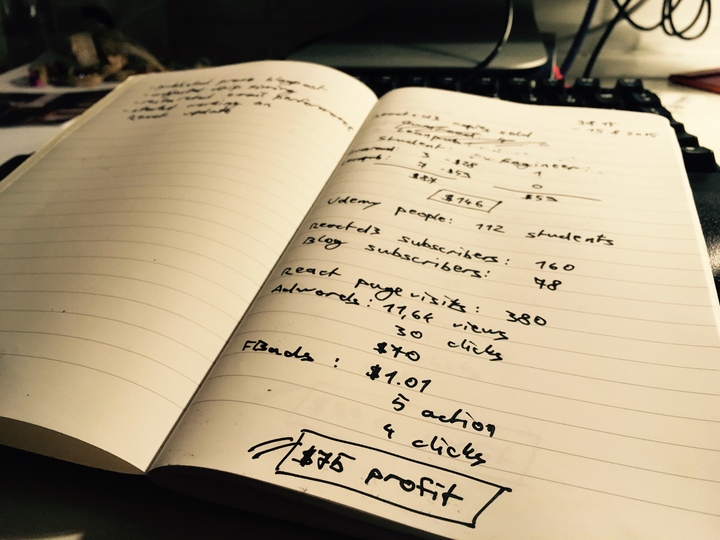
Every week, I would write down some numbers, take stock of how I pushed my side-hustle forward, and brainstorm some ideas on what to do next. Here’s what that first page said:
Sales this week - Aug 9th, 2015 - Aug 15th, 2015:
10 Student packages -> $87
1 Engineer package -> $59
Audience:
Udemy course -> 112 students1
Reactd3 email subscribers -> 160
Blog subscribers -> 78
Marketing
React page views: 380
Adwords: $70, 11k views, 30 clicks
FB ads: $1, 5 actions, 4 clicks
Things
- published promo blogpost, this one
- adjusted Drip campaign timing
- researched email performance
- started working on React+d3js update
Result
$75 profit
This Sunday, I wrote the last page that would fit in this notebook. Most entries were about a week apart, but some had an entire month between them. Life gets busy, and transcribing stats from charts you find online into a notebook is never a priority.
Here’s what the last page says:
Sales this week
7 student packages -> $117
4 Why programmers work at night -> $0
53 ES6 cheatsheet -> $8
Subscribers
Reactd3 -> 4,341
Why programmers work at night -> 736
Blog -> 944
Live coding -> 194
Medium -> 427
Marketing
FBads: $46, 29 leads, decent reach
Result
$201 loss ?
Things
- paid my editor
- I should move this to a spreadsheet
I probably should move my diary into a spreadsheet, but I’m on the fence about this. A spreadsheet makes it easier to look at trends and draw pretty graphs. A notebook makes it easier to appreciate life.
And yes, the last week in this diary is a $201 loss while the first week was a $75 profit. What a colossal failure! But not really. It fluctuates. Unlike a year ago, I have an editor now. I pay somebody to look at every single thing I publish.
I started looking for one right after that first week in the diary. A few weeks later, I had an editor. My side-hustle usually has a loss on the weeks that his monthly invoice comes through.
Such is life.
Here’s what happened in this year of side-hustling:
React Indie Bundle - 6 authors, 1 sale, $30k in a week
React+d3js ES6 - book rewrite, relaunch, $9k in first month
Weekly livecoding - pure fun, excuse to do cool shit
React+D3 workshops - 3 iterations, about $9k
ES6 cheatsheet - 1,184 emails, $314
Daily blogging experiment - ongoing, stay tuned
$27k in my share of sales2; 4 products launched; 2 things started to encourage doing cool shit; $4k spent on advertising; $2k on consultants; and some $2k on education materials.
That’s an overall profit of about $19k.
Which means I’m not investing enough in growth.
-
This was my Mastering d3.js video course published through Packt. It has since died a whimpering death and has gone from Udemy. I don’t know if it’s still making sales somewhere else. We never even broke through the advance amount. ↩︎
-
React Indie Bundle and the Workshops are a collaboration so I don’t get the whole pie. ↩︎
Filed under: BusinessLearningPersonalside businessSide Projects