Imagine living in 1854 London.
It's the center of the world. The richest city in the richest empire. Every day exciting new scientific, engineering, and medical discoveries. The age of enlightenment in full swing.
People dress like this

A Victorian businessman
Very dashing.
New railways all around you. Modern steam ships bring tea and spices from distant lands at unprecedented speeds. Never has life been so cushy. 🎩
But London also smells bad.
The streets are full of horse manure, the river Thames is filled with waste. You wear special shoe covers to keep shoes shiny while wading through mud and poop on your way to work.
People getting sick from Cholera all around you. Thousands of people. Nobody knows why.
Miasma is everyone's best bet. Invisible air particles.
What else could it be? The air smells bad and people get sick. The worse the air smells the sicker they are. Right? Maybe it's all the smog ... or the poop? Maybe industrial waste evaporating from the river?
You try to hold your breath.
And then John Snow draws a map. A very important map.

John Snow's Map
John Snow was studying Cholera outbreaks to figure out how they work. He had a bright idea: "What if I take a map and draw a line for every person sick from Cholera?"
It worked.
John looked at the map and realized these cases weren't random at all! They happen around a single water pump on Broad Street.
616 cases and the closer you get to the pump, the more common they become.
"IT MUST BE THE WATER! Cholera spreads through bad water!!" I bet he was excited.
Epidemiology was born. It would take another 26 years before everyone agreed that germs exist.
An early win for data visualization 💪
Engineers and developers
Software engineers, software developers, and programmers have the same job right?
They solve business problems with code and systems.
You come to them with an idea, a business problem, or a feature request. They figure out how to build it, how to make sure it works, how it fits into existing systems, and build a solution.
You probably do that all the time.
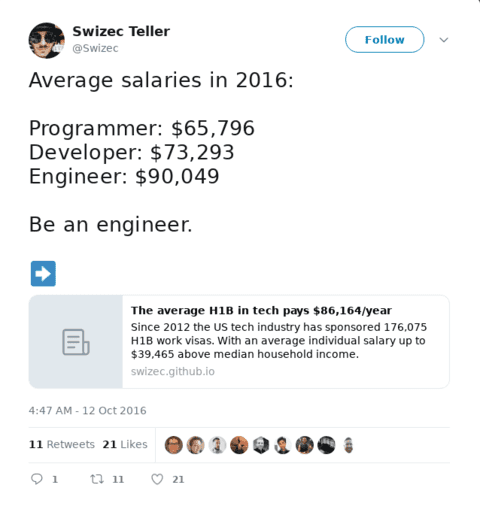
But did you know engineers make almost $30,000/year more than programmers? 🤨
It's true, I was just as surprised as you are.

I was looking into US visas a few years ago and realized that the H1B process creates a public dataset of salaries. When companies apply for your visa, they have to add salary info. It's one of the criteria.
The government announces results publicly. 🤔
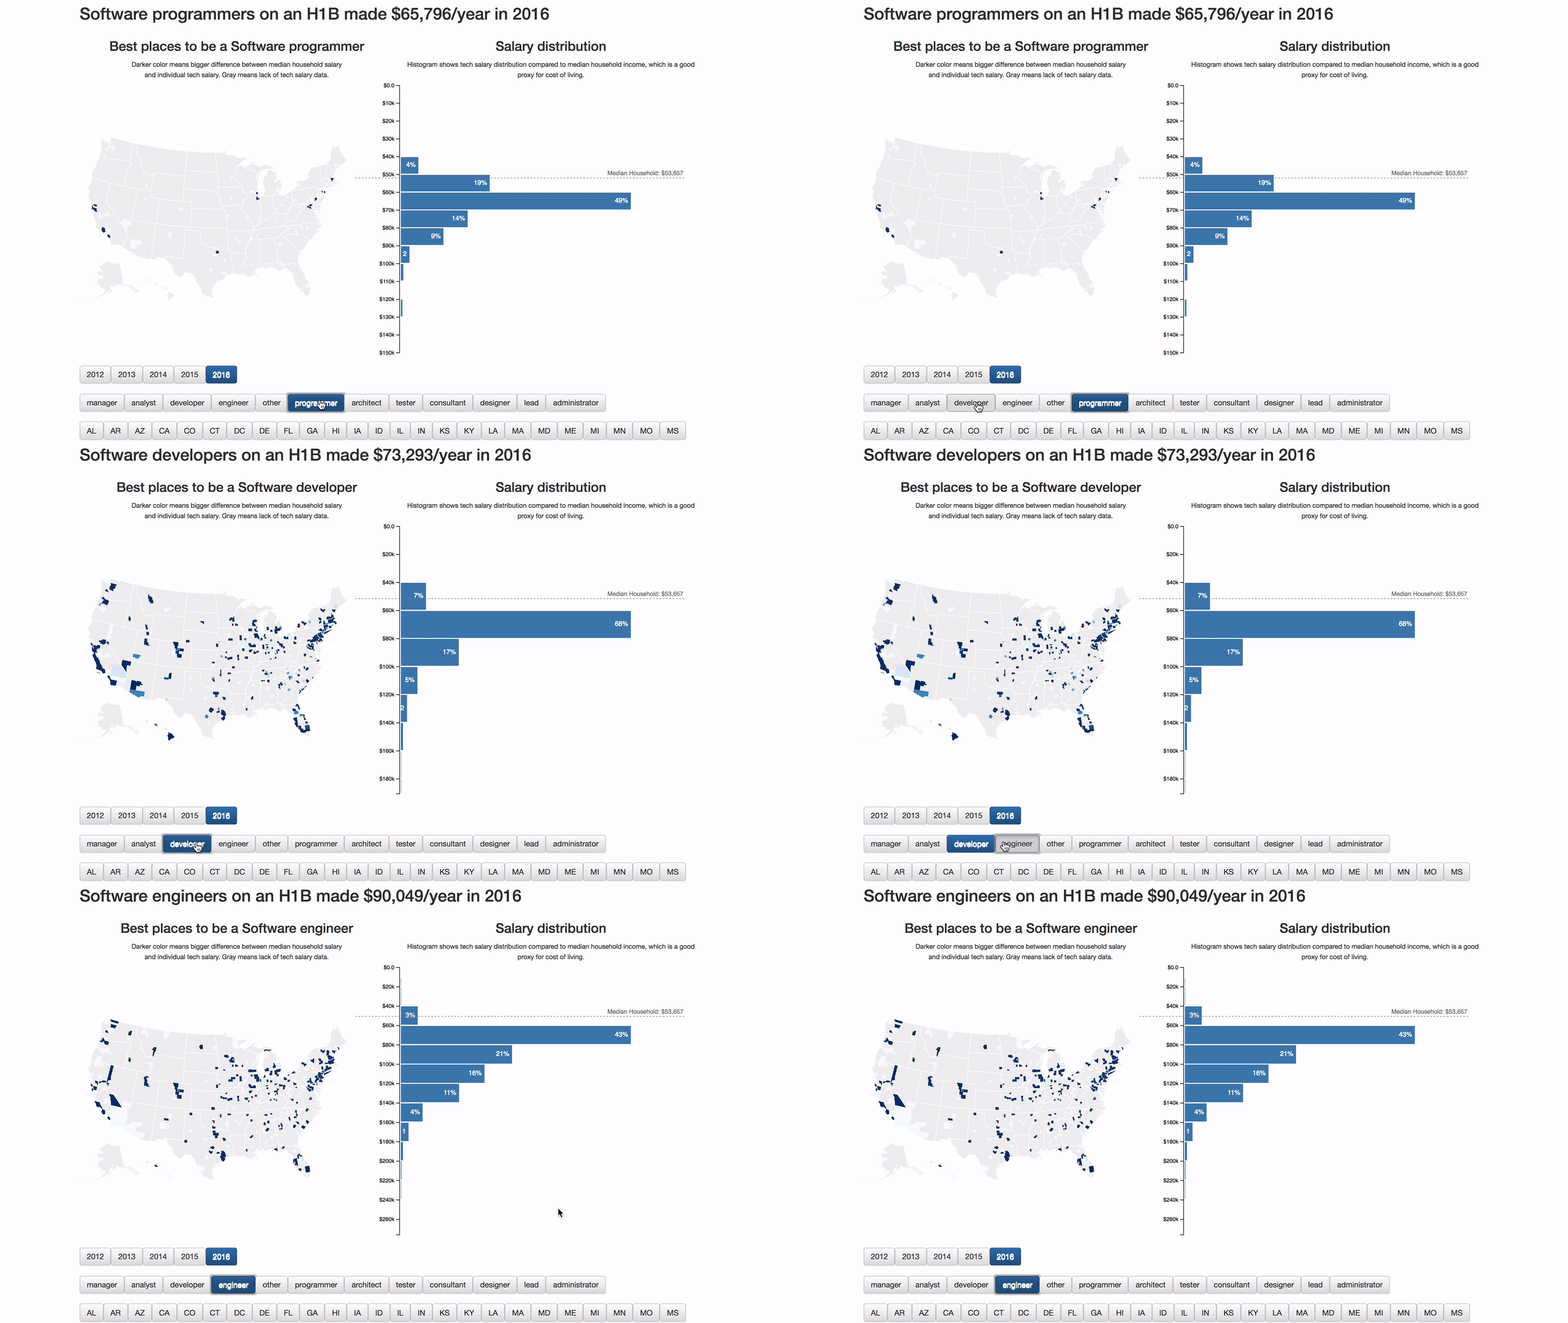
So I took the 177,826 software jobs I could find and visualized them on a graph. Filtered by job title, state, and year. The results were shocking

Not only do engineers average almost $30,000/year more than programmers, everyone who codes makes more than an entire median household in their area. 🤯
wow
Think about that next time you call yourself a programmer ;)
Dinosaurs
Say you're a scientist, a data scientist maybe, and you need a concise way to talk about a dataset. What do you do?
Summary statistics is what you do. Mean, standard deviation, correlation. ✌️
The mean tells you what an average datapoint looks like.
Standard deviation tells you how close to the mean most values lie. John Snow's map is one big standard deviation example.
Correlation tells you how much one variable affects another. If you change X, how much does Y change?
But what if vastly different datasets had the same summary statistics?
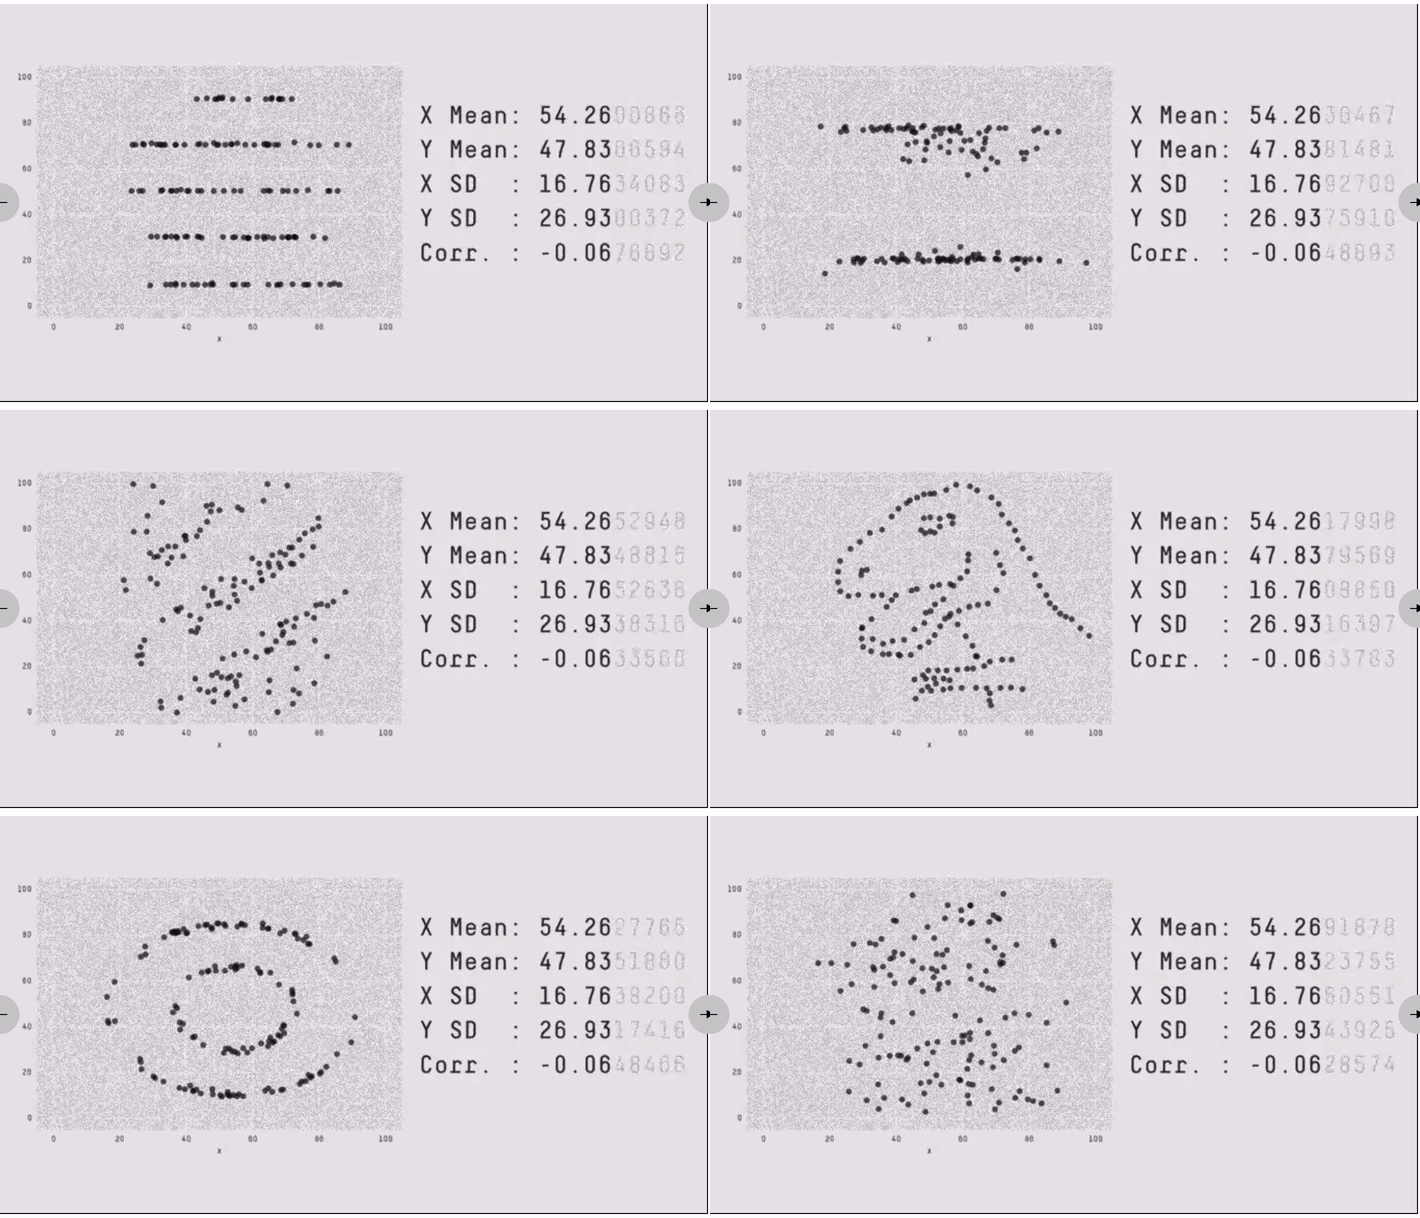
That's what Matejka and Fitzmaurice of Autodesk set out to discover in their research. They came up with this 👇

12 datasets, 12 pictures, 1 set of stats. One version even renders as a dinosaur!
And that's why you have to visualize your data to really understand what's going. Want to understand dinosaurs, engineers, or cholera? Gotta draw it out.

So tell me what's a time you were surprised by data? Tweet me
PS: did you know you're more likely to get hit by lighting thrice in the same year than to pick the perfect march madness bracket? Stats are weird
Continue reading about Dinosaurs, software engineers, and cholera. What do they have in common?
Semantically similar articles hand-picked by GPT-4
- Pirates’ downfall causes global warming
- Why coding is more fun than engineering
- JavaScript’s most popular dataviz library
- How to lie with facts
- When you don't think you're good enough
Learned something new?
Read more Software Engineering Lessons from Production
I write articles with real insight into the career and skills of a modern software engineer. "Raw and honest from the heart!" as one reader described them. Fueled by lessons learned over 20 years of building production code for side-projects, small businesses, and hyper growth startups. Both successful and not.
Subscribe below 👇
Software Engineering Lessons from Production
Join Swizec's Newsletter and get insightful emails 💌 on mindsets, tactics, and technical skills for your career. Real lessons from building production software. No bullshit.
"Man, love your simple writing! Yours is the only newsletter I open and only blog that I give a fuck to read & scroll till the end. And wow always take away lessons with me. Inspiring! And very relatable. 👌"
Have a burning question that you think I can answer? Hit me up on twitter and I'll do my best.
Who am I and who do I help? I'm Swizec Teller and I turn coders into engineers with "Raw and honest from the heart!" writing. No bullshit. Real insights into the career and skills of a modern software engineer.
Want to become a true senior engineer? Take ownership, have autonomy, and be a force multiplier on your team. The Senior Engineer Mindset ebook can help 👉 swizec.com/senior-mindset. These are the shifts in mindset that unlocked my career.
Curious about Serverless and the modern backend? Check out Serverless Handbook, for frontend engineers 👉 ServerlessHandbook.dev
Want to Stop copy pasting D3 examples and create data visualizations of your own? Learn how to build scalable dataviz React components your whole team can understand with React for Data Visualization
Want to get my best emails on JavaScript, React, Serverless, Fullstack Web, or Indie Hacking? Check out swizec.com/collections
Did someone amazing share this letter with you? Wonderful! You can sign up for my weekly letters for software engineers on their path to greatness, here: swizec.com/blog
Want to brush up on your modern JavaScript syntax? Check out my interactive cheatsheet: es6cheatsheet.com
By the way, just in case no one has told you it yet today: I love and appreciate you for who you are ❤️
