

This is a Livecoding Recap – an almost-weekly post about interesting things discovered while livecoding ?. Always under 500 words and with pictures. You can follow my channel, here. New content almost every Sunday at 2pm PDT. There’s live chat, come say hai ?
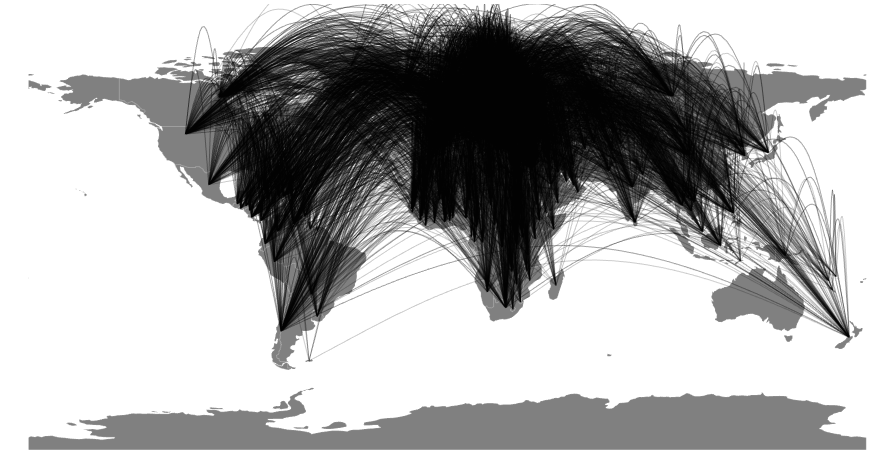
This Sunday, we built a colorful map and discovered that a marathon is 138,435 feet long. I don't know why Google thinks that's a useful answer to "How long is a marathon?”.
Our map shows migrations into the selected country and uses color to show migration magnitude. The more people that moved into a country in 2015, the warmer the color of that country and its curve. Or rather, the more to the right on the d3.interpolateWarm color scale.

I wouldn't describe green as warmer than purple… to be honest, I'm not sure what exactly interpolateWarm is meant to correspond to. But the way we used it, to the right is more and to the left is less. shrug
Guess we'll have to add a legend next week ?
But first, the curves. Last week, we discovered that a curve between two points is a straight line. We fixed that by adding a middle point calculated using high school geometry.

Our new Curve component looks like this:
const Curve = ({ start, end, color }) => {
    const line = d3.line()
                   .curve(d3.curveBasis),
          [x1, y1] = start,
          [x2, y2] = end,
          middle = [(x1 + x2)/2, (y1 + y2)/2-200];

    return (
        <path d="{line([start," middle,="" end])}="" style="{{stroke:" color,="" strokewidth:="" '1.6px',="" strokeopacity:="" '0.7',="" fillopacity:="" 0}}="">
    );
};
</path>
A line generator with a curve interpolator, some geometry for the middle point pulled up by -200 pixels, and returns a <path> element of a given color, and some other styling. We got the -200 number by fiddling around until it looked good.
That and some looping created a map with very many curves all over it. It was not very useful.
nikivansevdon suggested we add some sort of filtering, and daemon92 had great ideas around colors and highlighting source countries on the map itself. Thanks guys!
So we used react-select to make a drop down and spent far too much time rejigging our calculations to make the map aware of them. This is where having Redux or MobX becomes useful: When you want to move things around.
With those, you have data and calculations in a global state somewhere. With our haphazard approach, most logic gets slapped into the nearest component that uses it. It works great until you want to move something, then you're in a world of pain.
Watch the stream recording from about 1h20min onwards. You'll see what I mean. Copy-pasting. So much copy-pasting :D
You can see the final code on Github.
It came out quite well I think.

Next week, we'll add useful text info, a color legend, and add some animation to make the visualization quicker to understand. I want to add something that shows directionality for those curves.
If we can get special regions like World, Developed countries, etc. to work, that would be great too. ?
Continue reading about Livecoding #33: A Map of Global Migrations, Part 2
Semantically similar articles hand-picked by GPT-4
- Livecoding #32: A Map of Global Migrations, Part 1
- Livecoding #34: A Map of Global Migrations, Part 3
- Livecoding #24: A choropleth in React.js
- Livecoding #29: Optimizing React choropleth map rendering
- Livecoding #19: It’s hard to package a library
Learned something new?
Read more Software Engineering Lessons from Production
I write articles with real insight into the career and skills of a modern software engineer. "Raw and honest from the heart!" as one reader described them. Fueled by lessons learned over 20 years of building production code for side-projects, small businesses, and hyper growth startups. Both successful and not.
Subscribe below 👇
Software Engineering Lessons from Production
Join Swizec's Newsletter and get insightful emails 💌 on mindsets, tactics, and technical skills for your career. Real lessons from building production software. No bullshit.
"Man, love your simple writing! Yours is the only newsletter I open and only blog that I give a fuck to read & scroll till the end. And wow always take away lessons with me. Inspiring! And very relatable. 👌"

Have a burning question that you think I can answer? Hit me up on twitter and I'll do my best.
Who am I and who do I help? I'm Swizec Teller and I turn coders into engineers with "Raw and honest from the heart!" writing. No bullshit. Real insights into the career and skills of a modern software engineer.
Want to become a true senior engineer? Take ownership, have autonomy, and be a force multiplier on your team. The Senior Engineer Mindset ebook can help 👉 swizec.com/senior-mindset. These are the shifts in mindset that unlocked my career.
Curious about Serverless and the modern backend? Check out Serverless Handbook, for frontend engineers 👉 ServerlessHandbook.dev
Want to Stop copy pasting D3 examples and create data visualizations of your own? Learn how to build scalable dataviz React components your whole team can understand with React for Data Visualization
Want to get my best emails on JavaScript, React, Serverless, Fullstack Web, or Indie Hacking? Check out swizec.com/collections
Did someone amazing share this letter with you? Wonderful! You can sign up for my weekly letters for software engineers on their path to greatness, here: swizec.com/blog
Want to brush up on your modern JavaScript syntax? Check out my interactive cheatsheet: es6cheatsheet.com
By the way, just in case no one has told you it yet today: I love and appreciate you for who you are ❤️