I once asked Shirley Wu how she makes all her dataviz so pretty: Baskerville font and chroma-js.
Wow @sxywu was right, chroma.js really makes things pretty. pic.twitter.com/FWPhvmnGCR
— Swizec Teller (@Swizec) March 1, 2018
Chroma is a JavaScript library for dealing with colors. Read them, change them, make some delightful scales. It has changed the way I work.
I'm still new to the library, so I don't know everything. Here are some useful things I've found.
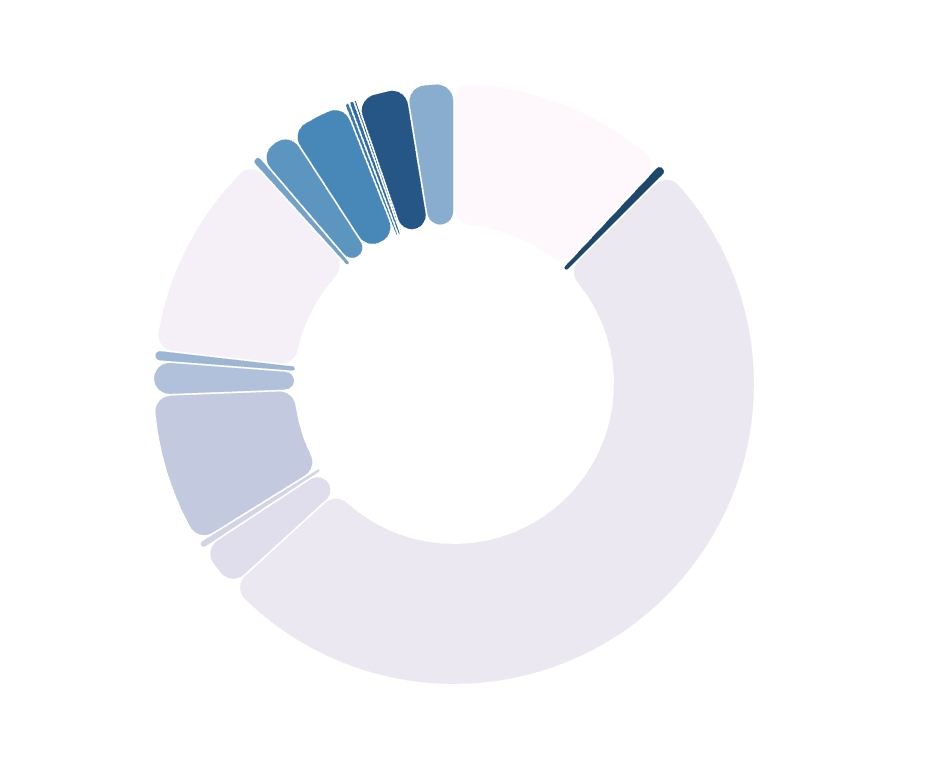
You can see them in action in this unfinished piechart showing how I spend money on transport. More on that next week.
Delightful color scales
Chroma color scales are designed to be delightful. You define two colors, and chroma-js finds the most pleasant path between them.
See the Pen Chroma basic scale by Swizec Teller (@swizec) on CodePen.
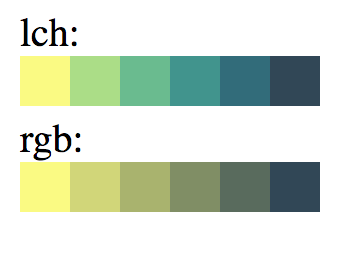
The quickest way to get some pretty colors going is to define an ordinal scale like this. Choose start and end points, say you want 6 colors, and pick the lch mode.
I'm not sure what lch mode means, but it creates nicer colors than the default rgb mode. They come out brighter.

You can create continuous scales as well. Add multiple points of reference etc. Great for encoding data with color.

Prettier hover effects

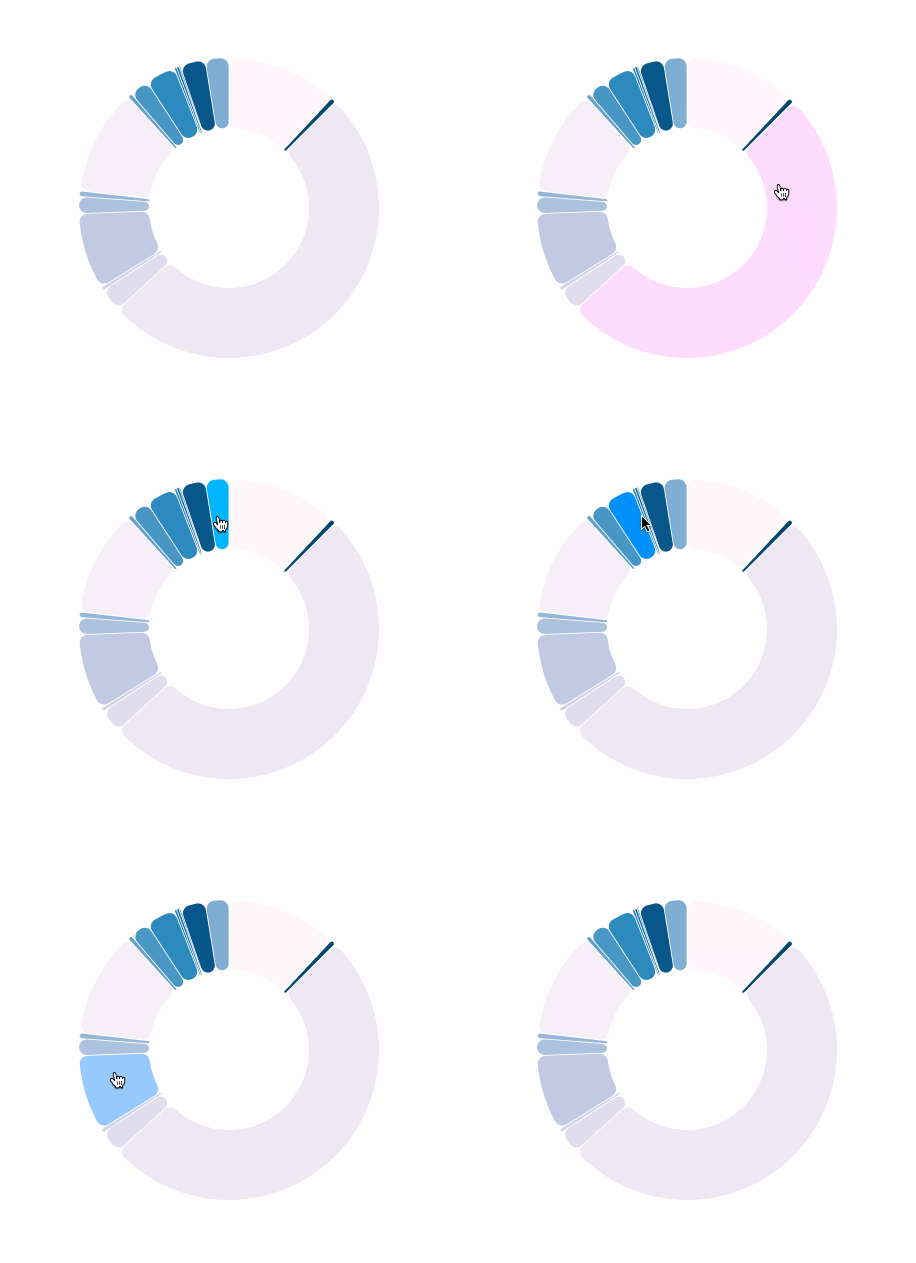
Chroma also helps you create prettier hover effects. Color effects in general, really.
You often see in web and dataviz design that people use opacity changes to create hover effects. You mouse over something and it becomes a little transparent so the white background shines through.
This works, but looks bland. It lightens the color. What you want instead is to make the color look brighter.
Chroma to the rescue with its color manipulation utilities.
chroma(color).brighten(2)
You can also saturate, desaturate, and darken. All useful effects if you find an excuse to use them. All better than just changing opacities.
Color brewer
If you're color challenged like me, then you can't go wrong with the color brewer utilities. A set of predefined colors that look great together.
That piechart above is made with the PuBu schema. chroma.scale("PuBu"). No need to worry too much, just go to color brewer, find a scheme you like, and tell Chroma to use it.
Happy coloring 🙏🏻
Continue reading about Make your things pretty with chroma-js
Semantically similar articles hand-picked by GPT-4
- JavaScript’s most popular dataviz library
- Quick scatterplot tutorial for d3.js
- Flotr2 - my favorite javascript graph library
- How to Make a Piechart using React and d3
- 3 key insights that make D3.js easy to learn
Learned something new?
Read more Software Engineering Lessons from Production
I write articles with real insight into the career and skills of a modern software engineer. "Raw and honest from the heart!" as one reader described them. Fueled by lessons learned over 20 years of building production code for side-projects, small businesses, and hyper growth startups. Both successful and not.
Subscribe below 👇
Software Engineering Lessons from Production
Join Swizec's Newsletter and get insightful emails 💌 on mindsets, tactics, and technical skills for your career. Real lessons from building production software. No bullshit.
"Man, love your simple writing! Yours is the only newsletter I open and only blog that I give a fuck to read & scroll till the end. And wow always take away lessons with me. Inspiring! And very relatable. 👌"
Have a burning question that you think I can answer? Hit me up on twitter and I'll do my best.
Who am I and who do I help? I'm Swizec Teller and I turn coders into engineers with "Raw and honest from the heart!" writing. No bullshit. Real insights into the career and skills of a modern software engineer.
Want to become a true senior engineer? Take ownership, have autonomy, and be a force multiplier on your team. The Senior Engineer Mindset ebook can help 👉 swizec.com/senior-mindset. These are the shifts in mindset that unlocked my career.
Curious about Serverless and the modern backend? Check out Serverless Handbook, for frontend engineers 👉 ServerlessHandbook.dev
Want to Stop copy pasting D3 examples and create data visualizations of your own? Learn how to build scalable dataviz React components your whole team can understand with React for Data Visualization
Want to get my best emails on JavaScript, React, Serverless, Fullstack Web, or Indie Hacking? Check out swizec.com/collections
Did someone amazing share this letter with you? Wonderful! You can sign up for my weekly letters for software engineers on their path to greatness, here: swizec.com/blog
Want to brush up on your modern JavaScript syntax? Check out my interactive cheatsheet: es6cheatsheet.com
By the way, just in case no one has told you it yet today: I love and appreciate you for who you are ❤️

