Building a React dataviz with React hooks
This is a crosspost from the #ReactVizHoliday project where I livecode a new dataviz every day until Christmas. Thought you might be interested ✌️
Click this to get the daily email 💌
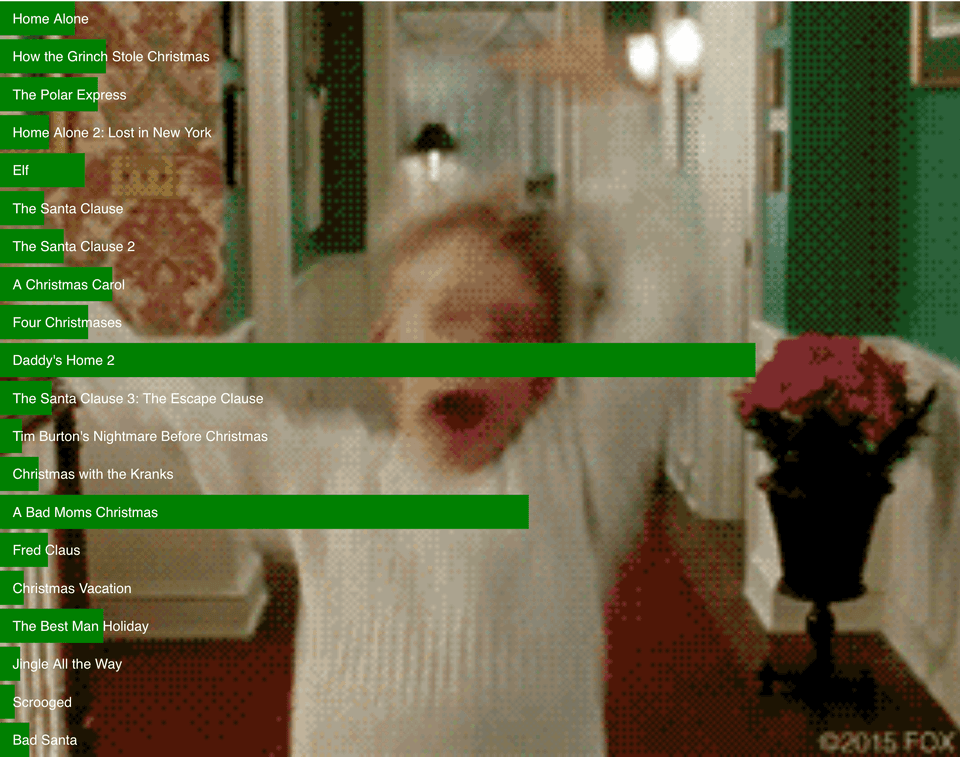
Christmas movies at the box office
Christmas movies are the best movies. How much do they make at the box office? Show the power law distribution curve with a vertical barchart.
We built this one with React hooks because we can. Not a class-based component in sight ✌️
Styled components for styling, D3 for scales and data loading and parsing, hooks to hook it all together.
Loading data with React hooks
I looked around for a good data-loading hook. None could be found. So we made our own 💪
Not that hard, as it turns out. You need a dash of useState to save the data you load, a bit of useEffect to run data loading on component mount aaaand… that's it. Goes in your App function.
function App() {
  const [data, setData] = useState(null);

  useEffect(
    () => {
      d3.tsv("/data.tsv", d => {
        const year = Number(d.movie.match(/\((\d )\)/)[1]);
        return {
          movie: d.movie.replace(/\(\d \)/, ""),
          year: year,
          per_year: Number(d.box_office) / (2018 - year),
          box_office: Number(d.box_office)
        };
      }).then(setData);
    },
    [!data]
  );
The useState hook takes a default value and always returns current state - data - and a setter - setData.
useEffect runs our function on every component render. After committing to the DOM, I believe. We use d3.tsv to load and parse our Christmas movie dataset, use a parsing function to transform each row into an object with all the info we need, then call setData when he have it.
Each datapoint holds
- a
moviename - the
yeara movie was produced parsed from the movie name with a regex - the
per_yearrevenue of the movie as a fraction - the total
box_officerevenue
Switch display modes with React hooks
Movie box office revenue follows a pretty clear power law distribution. The highest grossing movie or two make a lot more than the next best. Which makes way more than next one down the list, etc.
But how does age factor into this?
Home Alone has had 28 years to make its revenue. Daddy's Home 2 is only a year old.
I decided to add a button to switch modes. From total box_office to per_year revenue. And boy, does it change the story. Altho maybe I'm being unfair because how long are theater runs anyway? 🤔
Driving that logic with React hooks looks like this 👇
const [perYear, setPerYear] = useState(false)
const valueFunction = perYear ? d => d.per_year : d => d.box_office

// ...

<button onclick="{()" ==""> setPerYear(!perYear)}>
  {perYear ? "Show Total Box Office" : "Show Box Office Per Year"}
</button>
A useState hook gives us current state and a setter. We use the state, perYear, to define a value accessor function, and a butto's onClick method to toggle the value.
We're going to use that value accessor to render our graph. Makes the switch feel seamless.
Render
First, you need this bit in your App function. It renders ``in an SVG, if data exists.
<svg width="800" height="600" showkevin={perYear}>
  {data && (
    <verticalbarchart
      data={data}
      width={600}
      height={600}
      value={valueFunction}
    ></verticalbarchart>
  )}
</svg>
That data && ... is a common trick. The return value of true && something is something, return value of false && something is nothing. Means when data is defined, we render; otherwise, we don't.
Oh, and Svg is a styled SVG component. Gets a nice gif background when showKevin is set to true 😛
The VerticalBarchart itself is a functional component. We said no classes right?
const VerticalBarchart = ({ data, width, height, value }) => {
  const yScale = d3
    .scaleBand()
    .paddingInner(0.1)
    .domain(data.map(d => d.movie))
    .range([0, height])
  const widthScale = d3
    .scaleLinear()
    .domain([0, d3.max(data, value)])
    .range([0, width])

  return (
    <g>
      {data.map(d => (
        <react class="fragment" key={d.movie}>
          <bar x={0} y={yScale(d.movie)} height={yScale.bandwidth()} width={widthScale(value(d))}>
          <label x={10} y="{yScale(d.movie)" yscale.bandwidth()="" 2}="">
            {d.movie}
          </label>
        </bar></react>
      ))}
    </g>
  )
}
We can define our D3 scales right in the render function. Means we re-define them from scratch on every render and sometimes, that's okay. Particularly when data is small and calculating domains and ranges is easy.
Once we have a scaleBand for the vertical axis and a scaleLinear for widths, it's a matter of iterating over our data and rendering styled andcomponents.
Notice that we use the value accessor function every time we need the value of a datapoint. To find the max value for our domain and to grab each individual width.
Makes our chart automatically adapt to flicking that perYear toggle 👌
That smooth width transition effect? That's just CSS.
const Bar = styled.rect`
  fill: green;
  transition: width 500ms;
`;
React hooks really do make life easy 🎣
What you learned today
- the
useStateReact hook - the
useEffectReact hook - that it's okay to define D3 stuff in the render method; sometimes
Cheers, ~Swizec
Filed under: FrontendTechnical