For the past couple of months I've been involved with an experiment that primarily involves taking a few moments every day to write down some numbers. I haven't gotten the clearance yet to quite say what exactly the data we are logging represents, but I can tell you about why I'm never again using spreadsheets to do this sort of stuff.
Over the weekend I started working on producing some graphs and useful understandable data out of two months of spreadsheets. The summer ones.
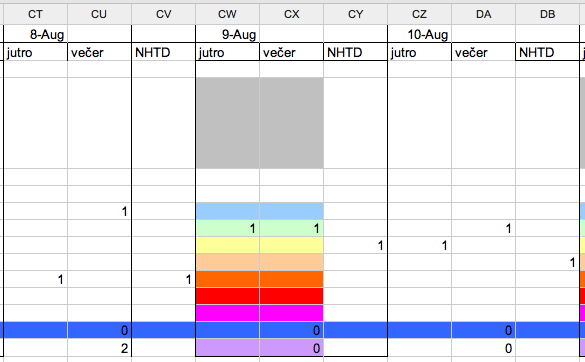
Turns out exporting to CSV then trying to import into a processable python data structure is less than easy when your tables were designed so that they look good as tables, are easy for humans to use and make sense when you look at them. The problem with python's handling of CSV is that it doesn't have any idea what my data actually looks like so it just produces a list of lists with values of all the cells.
My problem was that we were collecting three values for every day ... but until about a month in, we were only collecting two values. On top of that six rows translate into what is actually a single row of data with a certain range of values. In a table it's easier for people to use as six rows, but trying to draw a graph from that ... well you'd want a single row.

After quite a bit of muscling around and playing with more list comprehensions than fit comfortably in my head, that same data looks like this and is much more manageable.
{'A': [[2, 3, -1], [3, 1, -1], [2, 2, -1], [2, 0, -1], [1, 0, -1], ...],
'B': [0, 0, 0, 0, 0, 0, 0, 0, 0, 0, 0, 0, 0, 0, 0, 0, 2, 0, ...]
'C': [0, 0, 1, 0, 0, 0, 1, 0, 1, 0, 0, 0, 1, ...], }
It pains me to admit it, but it took much too long to write a lens between the spreadsheet data and the data structure I can now actually use. Don't do this to yourselves and just make sure that whenever you are collecting data for a long lasting experiment, write some sort of easy interface that pops values right into the database.
It will make your life easier.
Continue reading about Collect your data carefully, a lesson
Semantically similar articles hand-picked by GPT-4
- Sabbatical week day 2: I fail at Octave
- Sabbatical week day 3: Raining datatypes
- I want to analyze your blog
- It ain't stupid if it works
- Sabbatical week day 1: Toshl and Toggl datasets
Learned something new?
Read more Software Engineering Lessons from Production
I write articles with real insight into the career and skills of a modern software engineer. "Raw and honest from the heart!" as one reader described them. Fueled by lessons learned over 20 years of building production code for side-projects, small businesses, and hyper growth startups. Both successful and not.
Subscribe below 👇
Software Engineering Lessons from Production
Join Swizec's Newsletter and get insightful emails 💌 on mindsets, tactics, and technical skills for your career. Real lessons from building production software. No bullshit.
"Man, love your simple writing! Yours is the only newsletter I open and only blog that I give a fuck to read & scroll till the end. And wow always take away lessons with me. Inspiring! And very relatable. 👌"
Have a burning question that you think I can answer? Hit me up on twitter and I'll do my best.
Who am I and who do I help? I'm Swizec Teller and I turn coders into engineers with "Raw and honest from the heart!" writing. No bullshit. Real insights into the career and skills of a modern software engineer.
Want to become a true senior engineer? Take ownership, have autonomy, and be a force multiplier on your team. The Senior Engineer Mindset ebook can help 👉 swizec.com/senior-mindset. These are the shifts in mindset that unlocked my career.
Curious about Serverless and the modern backend? Check out Serverless Handbook, for frontend engineers 👉 ServerlessHandbook.dev
Want to Stop copy pasting D3 examples and create data visualizations of your own? Learn how to build scalable dataviz React components your whole team can understand with React for Data Visualization
Want to get my best emails on JavaScript, React, Serverless, Fullstack Web, or Indie Hacking? Check out swizec.com/collections
Did someone amazing share this letter with you? Wonderful! You can sign up for my weekly letters for software engineers on their path to greatness, here: swizec.com/blog
Want to brush up on your modern JavaScript syntax? Check out my interactive cheatsheet: es6cheatsheet.com
By the way, just in case no one has told you it yet today: I love and appreciate you for who you are ❤️

