


The new React 16.3 brings some changes to the ecosystem that change how we go about integrating React and D3 to build data visualizations. I previously wrote about this in Declarative D3 transitions with React 16.3
componentWillReceiveProps, componentWillUpdate and componentWillMount are on their way out. They were great for making React and D3 happy together, but they cause issues with async rendering that the React team is planning for React 17.
You tend to use those now-deprecated lifecycle methods to update D3 objects’ internal state. Things like setting scale domains and ranges, updating complex D3 layouts, setting up transitions, etc.
But you don’t need to! You can do it all with the new lifecycle API.
Here’s a small example of building a bar chart with React 16.3. Using only approved lifecycle callbacks 😏
You can play with it on CodeSandbox 👇
How it works
The core problem we're solving is that D3 objects like to keep internal state and React doesn't like that. We have to update D3 objects whenever our React component gets new props.
You have to update a scale mapping data to x-axis pixels whenever either data or width change. Traditionally you would do that in componentWillReceiveProps.
React docs recommend replacing componentWillReceiveProps with componentDidUpdate, but that leads to rendering stale charts. If you update your D3 scales after your component re-renders, that's too late.
Instead, we can move our scales into state and use getDerivedStateFromProps. 🤯
That's right, you can have complex objects in state now. It's totally safe.
Here's the gist of it 👇
D3 in state
Defining D3 objects as component properties used to be best. Now you should do it in your component state.
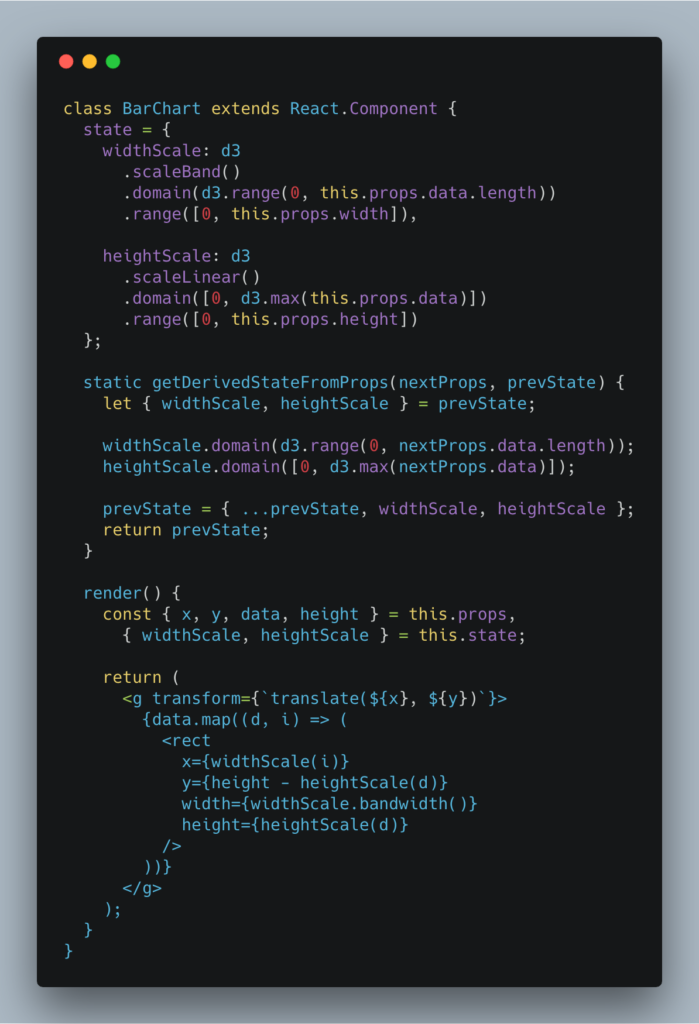
    class BarChart extends React.Component {
      state = {
        widthScale: d3
          .scaleBand()
          .domain(d3.range(0, this.props.data.length))
          .range([0, this.props.width]),

        heightScale: d3
          .scaleLinear()
          .domain([0, d3.max(this.props.data)])
          .range([0, this.props.height])
      };
We define a widthScale and a heightScale. Each has a domain and a range that both depend on this.props. Yes you can do that in JavaScript class fields syntax.
Update D3 in getDerivedStateFromProps
You then use getDerivedStateFromProps to keep those scales up to date when your component updates.
      static getDerivedStateFromProps(nextProps, prevState) {
        let { widthScale, heightScale } = prevState;

        widthScale.domain(d3.range(0, nextProps.data.length));
        heightScale.domain([0, d3.max(nextProps.data)]);

        prevState = { ...prevState, widthScale, heightScale };
        return prevState;
      }
It's a static method, which means no this keyword for you, you're running on the class, not an instance. You get the new props and the current state.
Take widthScale and heightScale out of props, update their domains, put them back. Probably should update their ranges too.
Render your chart
Now that your scales are always up to date, you can render your chart. Same as usual, D3 for props, React for rendering.
      render() {
        const { x, y, data, height } = this.props,
          { widthScale, heightScale } = this.state;

        return (
          <g transform="{`translate(${x}," ${y})`}="">
            {data.map((d, i) => (
              <rect x={widthScale(i)} y="{height" -="" heightscale(d)}="" width={widthScale.bandwidth()} height={heightScale(d)}>
            ))}
          </rect></g>
        );
      }
Get chart coordinates, data, and height from props. Grab widthScale and heightScale. Return a <g> element full of rectangles.
Each rectangle is rendered in a loop and takes its coordinates and dimensions from our scales.
The result after a splash of color: A BarChart of random numbers where height and color correlate to the value. 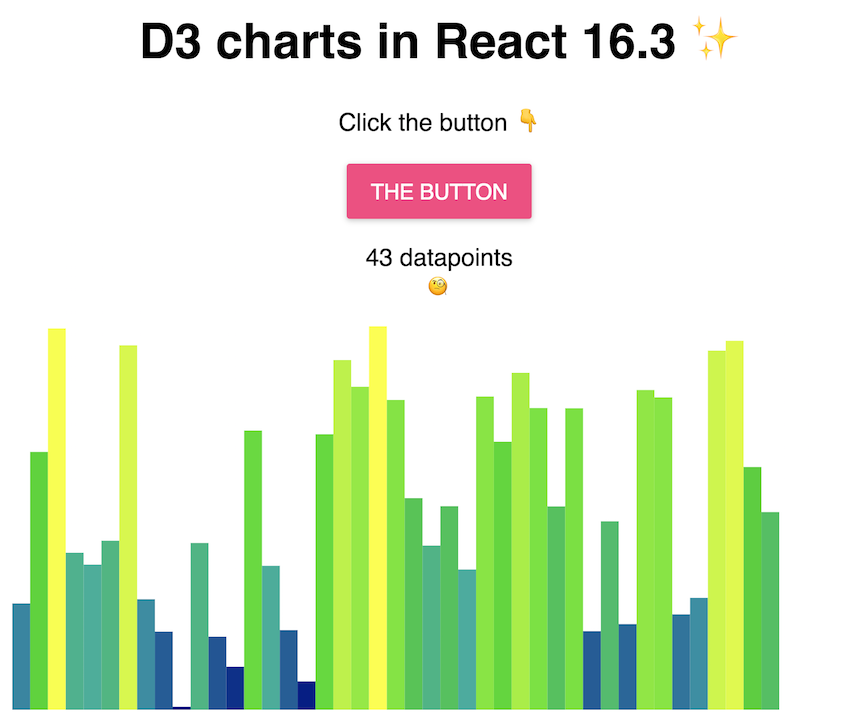 I also made a button that lets you add random values to the chart. That way you can see that it's updating perfectly declaratively. Update props and the chart updates. No need to understand implementation details.
You can play with it on CodeSandbox.
Pushing it too far
You can render 100,000 SVG nodes in CodeSandbox if you're patient. Then you can't edit your code anymore.
You can render 100,000 SVG elements in @codesandboxapp and then you can't edit your code anymore.
— Swizec Teller (@Swizec) April 27, 2018
👉 https://t.co/8IQCpZteAq pic.twitter.com/NRjp7iVWrE
Continue reading about Declarative D3 charts with React 16.3
Semantically similar articles hand-picked by GPT-4
- Declarative D3 transitions with React 16.3
- Livecoding Recap: A new more versatile React pattern
- Easy D3 blackbox components with React hooks
- The two ways to build a zoomable dataviz component with d3.zoom and React
- Livecoding #19: It’s hard to package a library
Learned something new?
Read more Software Engineering Lessons from Production
I write articles with real insight into the career and skills of a modern software engineer. "Raw and honest from the heart!" as one reader described them. Fueled by lessons learned over 20 years of building production code for side-projects, small businesses, and hyper growth startups. Both successful and not.
Subscribe below 👇
Software Engineering Lessons from Production
Join Swizec's Newsletter and get insightful emails 💌 on mindsets, tactics, and technical skills for your career. Real lessons from building production software. No bullshit.
"Man, love your simple writing! Yours is the only newsletter I open and only blog that I give a fuck to read & scroll till the end. And wow always take away lessons with me. Inspiring! And very relatable. 👌"

Have a burning question that you think I can answer? Hit me up on twitter and I'll do my best.
Who am I and who do I help? I'm Swizec Teller and I turn coders into engineers with "Raw and honest from the heart!" writing. No bullshit. Real insights into the career and skills of a modern software engineer.
Want to become a true senior engineer? Take ownership, have autonomy, and be a force multiplier on your team. The Senior Engineer Mindset ebook can help 👉 swizec.com/senior-mindset. These are the shifts in mindset that unlocked my career.
Curious about Serverless and the modern backend? Check out Serverless Handbook, for frontend engineers 👉 ServerlessHandbook.dev
Want to Stop copy pasting D3 examples and create data visualizations of your own? Learn how to build scalable dataviz React components your whole team can understand with React for Data Visualization
Want to get my best emails on JavaScript, React, Serverless, Fullstack Web, or Indie Hacking? Check out swizec.com/collections
Did someone amazing share this letter with you? Wonderful! You can sign up for my weekly letters for software engineers on their path to greatness, here: swizec.com/blog
Want to brush up on your modern JavaScript syntax? Check out my interactive cheatsheet: es6cheatsheet.com
By the way, just in case no one has told you it yet today: I love and appreciate you for who you are ❤️