This is a Livecoding Recap – an almost-weekly post about interesting things discovered while livecoding ?. Always under 500 words and with pictures. You can follow my channel, here. New content almost every Sunday at 2pm PDT. There’s live chat, come say hai ?
I just spent 3 hours normalizing datasets. Then I wrote a script that did it in less than 5 seconds. I am not a smart man.
Did you know there were 32 states with a Washington county in the US? And there are 24 Jackson counties? 16 Wayne counties… 12 Marshalls… ?
County names are only unique per-state, not per-all-of-the-country. Now you know. And now I know, too!
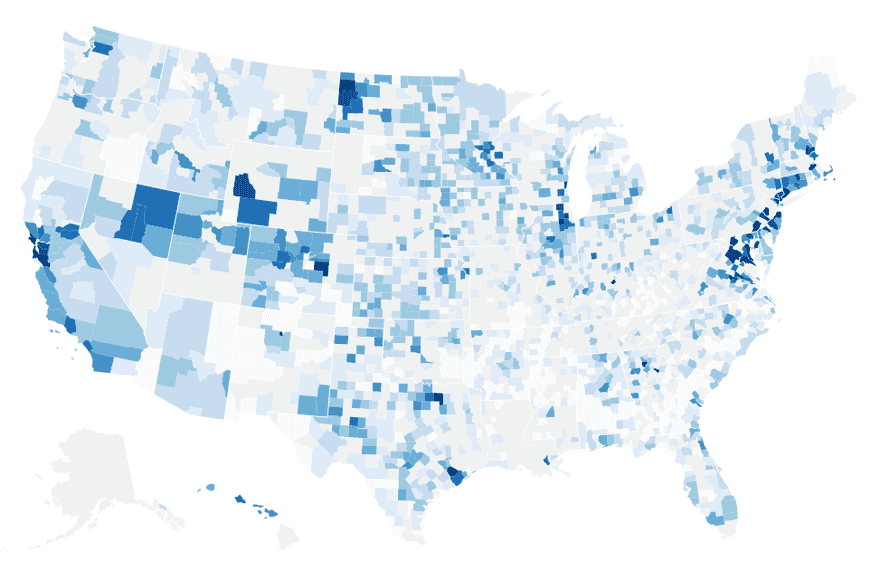
Fixing that problem let me turn this picture from livecoding:

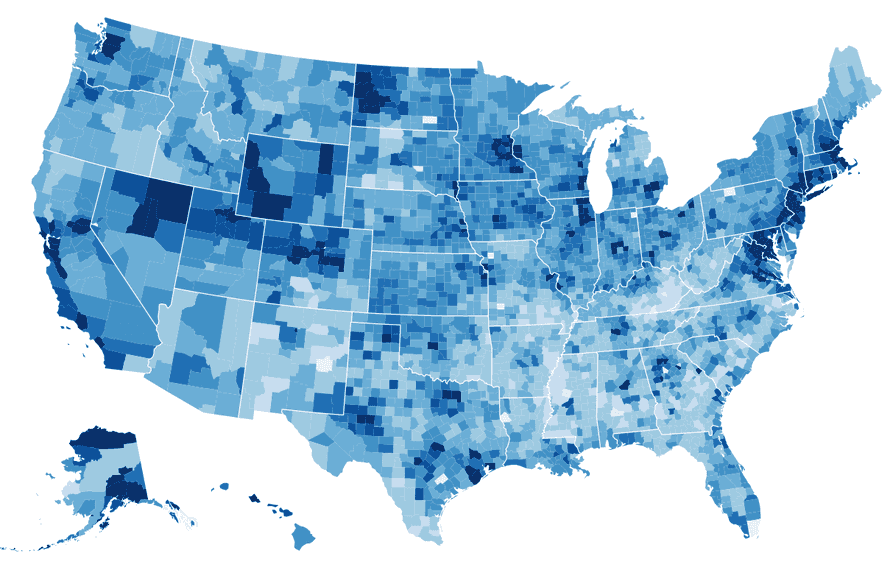
Into this picture:

The latter has less gray and more blue. That’s good. It means there are fewer counties that didn’t match our dataset. Some remain. I don’t know how to fix those.
You’re looking at a choropleth map of median household incomes in the United States that I built with React and D3v4.
Buffalo County in South Dakota is the poorest county in the US with a median household income of $21,658. City of Falls Church County in Virginia is the richest with $125,635. Richest part of the country is about 6x richer than the poorest. ?
These are medians we’re talking about, not maximums. In both cases, 90% of households fall within a few thousand dollars of the median.
More about that later this week when we compare this median household data to that dataset of salaries in the software industry. That should be fun ?
Here’s how it’s built
We cribbed off of Mike Bostock’s choropleth example and modified it for React.
After loading our datasets – a TopoJSON of US counties and states (geo info) and a table of median household incomes per county – we start with a CountyMap component. It draws the overall map and deals with calculating the quantize threshold scale for colors.
The component is about 50 lines, so I added comments to each method.
class CountyMap extends Component {
    // Setup default D3 objects
    // projection - defines our geo projection, how the map looks
    // geoPath - calculates d attribute of <path> so it looks like a map
    // quantize - threshold scale with 9 buckets
    constructor(props) {
        super(props);

        this.projection = d3.geoAlbersUsa()
                            .scale(1280);
        this.geoPath = d3.geoPath()
                         .projection(this.projection);
        this.quantize = d3.scaleQuantize()
                          .range(d3.range(9));

        this.updateD3(props);
    }

    // update D3 objects when props update
    componentWillReceiveProps(newProps) {
        this.updateD3(newProps);
    }

    // Re-center the geo projection
    // Update domain of quantize scale
    updateD3(props) {
        this.projection.translate([props.width / 2, props.height / 2]);

        if (props.medianIncomes) {
            this.quantize.domain([10000, 75000]);
        }
    }

    // If no data, do nothing (we might mount before data loads into props)
    render() {
        if (!this.props.usTopoJson) {
            return null;
        }else{
            // Translate topojson data into geojson data for drawing
            // Prepare a mesh for states and a list of features for counties
            const us = this.props.usTopoJson,
                  statesMesh = topojson.mesh(us, us.objects.states, (a, b) => a !== b),
                  counties = topojson.feature(us, us.objects.counties).features;

            // Loop through counties and draw <county> components
            // Add a single <path> for state borders
            return (
                <g>
                    {counties.map((feature) => <county geopath={this.geoPath} feature={feature} key={feature.id} quantize={this.quantize} data="{_.find(this.props.medianIncomes," {countyid:="" feature.id})}="">)}

                     <path d={this.geoPath(statesMesh)} style="{{fill:" 'none',="" stroke:="" '#fff',="" strokelinejoin:="" 'round'}}="">
                </path></county></g>
            );
        }
    }
}
</path></county></path>
I hope that makes sense. It follows my standard React+D3js approach.
For the counties, we can use a stateless functional component that gets all relevant data through props. It looks like this:
// Combine array of colors and quantize scale to pick fill colo
// Return a <path> element
const County = ({ data, geoPath, feature, quantize }) => {
    let color = BlankColor;

    if (data) {
        color = ChoroplethColors[quantize(data.medianIncome)];
    }

    return (<path d={geoPath(feature)} style="{{fill:" color}}="" title={feature.id}>)
};
</path></path>
With some setup and a bit of data loading, those two components create a choropleth map of median household incomes in the United States. Watch the video to see how it all fits together.
P.S.: the edited and improved versions of these videos are becoming a video course. Readers of the engineer package of React+d3js ES6 get the video course for free when it’s ready.
Continue reading about Livecoding #24: A choropleth in React.js
Semantically similar articles hand-picked by GPT-4
- Livecoding #29: Optimizing React choropleth map rendering
- Livecoding #33: A Map of Global Migrations, Part 2
- Livecoding #32: A Map of Global Migrations, Part 1
- Livecoding #34: A Map of Global Migrations, Part 3
- How you can translate any random D3 example to React
Learned something new?
Read more Software Engineering Lessons from Production
I write articles with real insight into the career and skills of a modern software engineer. "Raw and honest from the heart!" as one reader described them. Fueled by lessons learned over 20 years of building production code for side-projects, small businesses, and hyper growth startups. Both successful and not.
Subscribe below 👇
Software Engineering Lessons from Production
Join Swizec's Newsletter and get insightful emails 💌 on mindsets, tactics, and technical skills for your career. Real lessons from building production software. No bullshit.
"Man, love your simple writing! Yours is the only newsletter I open and only blog that I give a fuck to read & scroll till the end. And wow always take away lessons with me. Inspiring! And very relatable. 👌"
Have a burning question that you think I can answer? Hit me up on twitter and I'll do my best.
Who am I and who do I help? I'm Swizec Teller and I turn coders into engineers with "Raw and honest from the heart!" writing. No bullshit. Real insights into the career and skills of a modern software engineer.
Want to become a true senior engineer? Take ownership, have autonomy, and be a force multiplier on your team. The Senior Engineer Mindset ebook can help 👉 swizec.com/senior-mindset. These are the shifts in mindset that unlocked my career.
Curious about Serverless and the modern backend? Check out Serverless Handbook, for frontend engineers 👉 ServerlessHandbook.dev
Want to Stop copy pasting D3 examples and create data visualizations of your own? Learn how to build scalable dataviz React components your whole team can understand with React for Data Visualization
Want to get my best emails on JavaScript, React, Serverless, Fullstack Web, or Indie Hacking? Check out swizec.com/collections
Did someone amazing share this letter with you? Wonderful! You can sign up for my weekly letters for software engineers on their path to greatness, here: swizec.com/blog
Want to brush up on your modern JavaScript syntax? Check out my interactive cheatsheet: es6cheatsheet.com
By the way, just in case no one has told you it yet today: I love and appreciate you for who you are ❤️

