This is a Livecoding Recap – an almost-weekly post about interesting things discovered while livecoding ?. Always under 500 words and with pictures. You can follow my channel, here. New content almost every Sunday at 2pm PDT. There’s live chat, come say hai ?
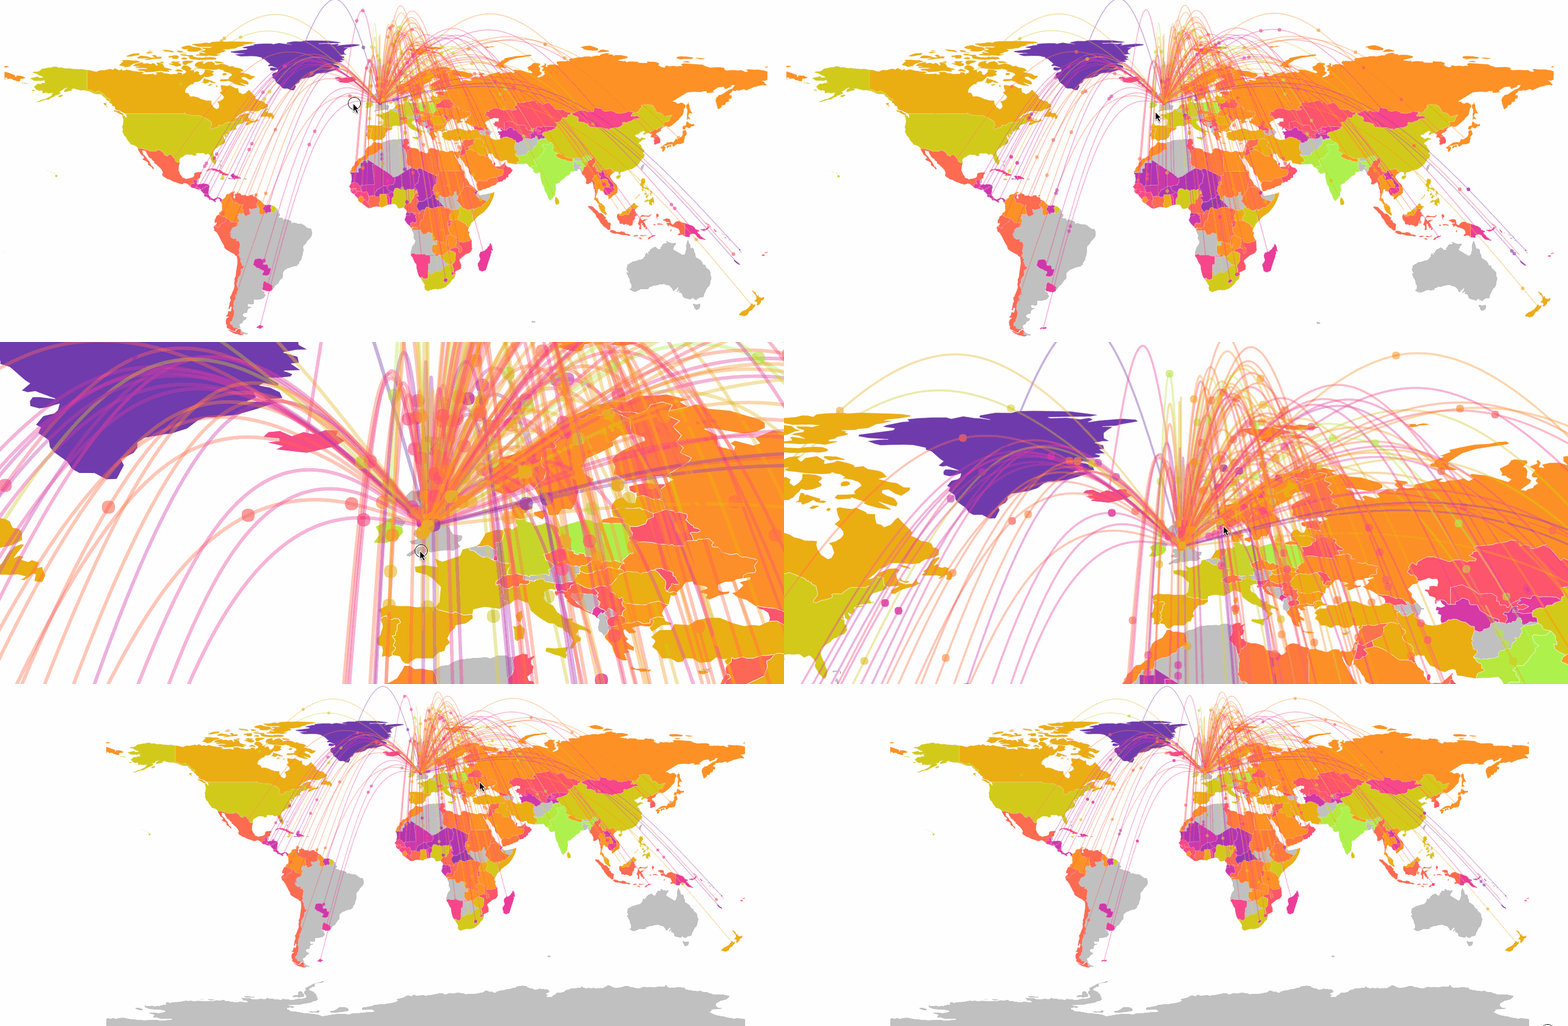
This Sunday, we built a zoomable pannable map with React and D3. We also added animation to our migration curves. Now people can see what they mean.

See? It zooms and it pans and the circles follow their curves. Just like the color, the amount of circles on each line signifies migration intensity. ?
Here's how it works ?
Animate SVG element to follow a curve
Moving an element along a line is one of those things you think you can figure out on your own but you can't. Then you see how it's done and you think, "I'm dumb".
But you're not dumb. It's totally un-obvious.
We used Bostock's Point-Along-Line Interpolation example as our model. It creates a custom tween that we apply to each circle as an attrTween transition.
function translateAlong(path) {
  var l = path.getTotalLength();
  return function (d, i, a) {
    return function (t) {
      var p = path.getPointAtLength(t * l);
      return "translate(" + p.x + "," + p.y + ")";
    };
  };
}
That's the custom tween. I'd love to explain how it works, but… well, we have a getPointAtLength function that SVG gives us by default on every <path> element. We use it to generate translate(x, y) strings that we feed into the transform attribute of a <circle> element. That part is obvious.
The part I don't get is the 3-deep function nesting for currying. The top function returns a tween, I assume. It's a function that takes d, i, a as arguments and never uses them. Instead, it returns a time-parametrized function that returns a translate(x, y) string for each t.
We know from D3 conventions that t runs in the [0, 1] interval, so we can assume the tween gives a "point at t percent of full length of path" coordinates.
Great.
We apply it in our MigrationLine component like this:
// inside MigrationLine
    _transform(circle, delay) {
        const { start } = this.props,
              [ x1, y1 ] = start;

        d3.select(circle)
          .attr("transform", `translate(${x1}, ${y1})`)
          .transition()
          .delay(delay)
          .duration(this.duration)
          .attrTween("transform", translateAlong(this.refs.path))
          .on("end", () => {
              if (this.state.keepAnimating) {
                  this._transform(circle, 0);
              }
          });
    }

    componentDidMount() {
        const { Ncircles } = this.props;

        this.setState({
            keepAnimating: true
        });

        const delayDither = this.duration*Math.random(),
              spread = this.duration/Ncircles;

        d3.range(delayDither, this.duration+delayDither, spread)
          .forEach((delay, i) =>
              this._transform(this.refs[`circles-${i}`], delay)
          );
    }
We call _transform on every circle in our component. Each gets a different delay so that we get a roughly uniform distribution of circles on the line. Without this, they come in bursts, and it looks weird.
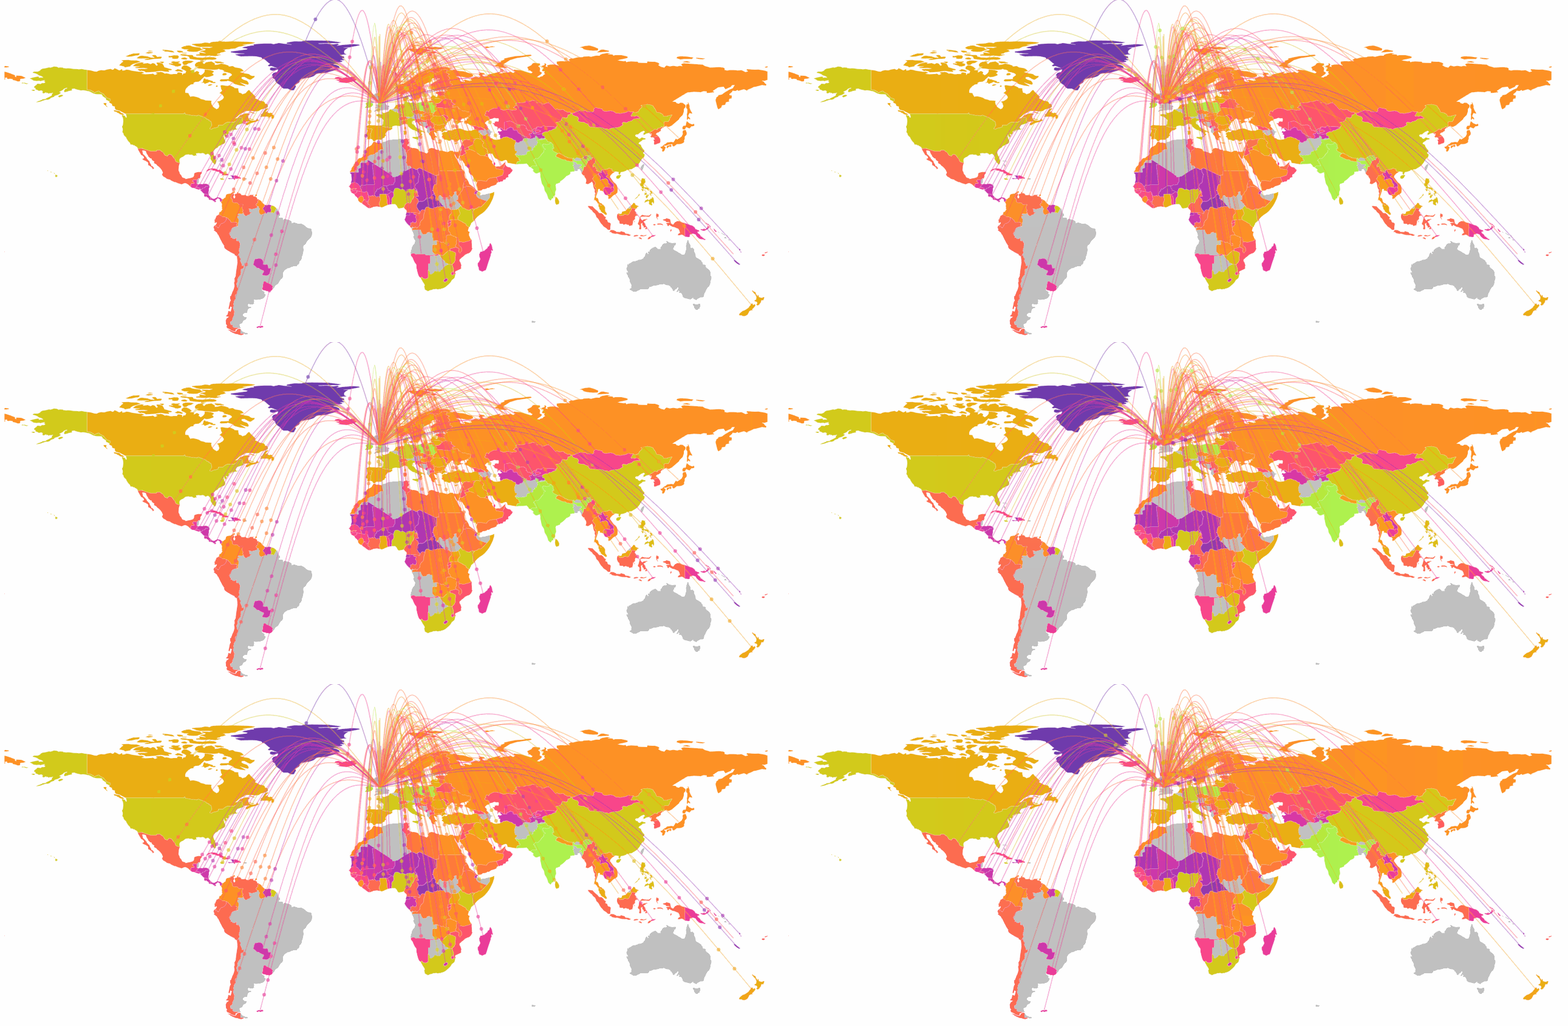
delayDither ensures the circles for each line start with a random offset, which also helps fight the burstiness. Here's what the map looks like without delayDither and with a constant delay between circles regardless how many there are.

See? No good.
You can see the full MigrationLine code on Github.
Zoom and pan a map
This part was both harder and easier than I thought.
You see, D3 comes with something called d3.zoom. It does zooming and panning.
Cool, right? Should be easy to implement. And it is… if you don't fall down a rabbit hole.
In the old days, the standard approach was to .call() zoom on an <svg> element, listen for zoom events, and adjust your scales. Zoom callback would tell you how to change zoominess and where to move, and you'd adjust your scales and re-render the visualization.
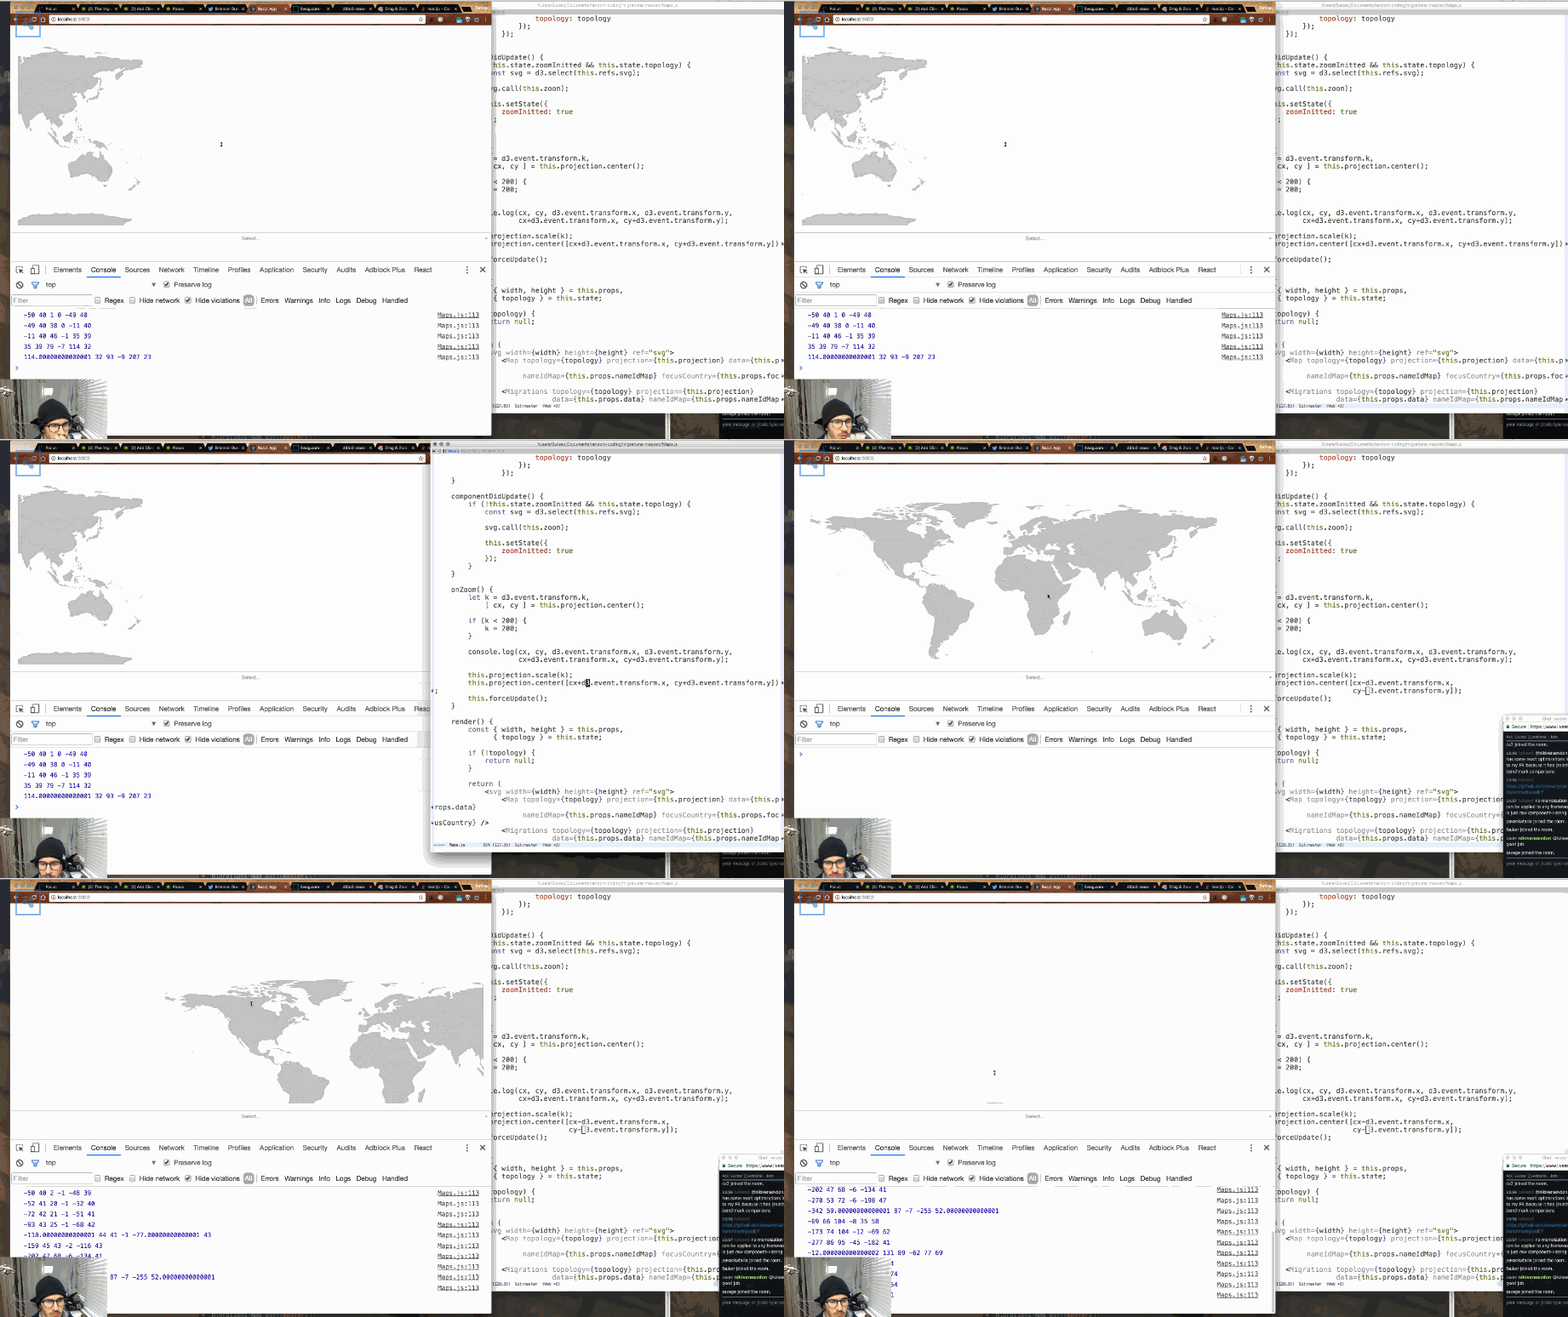
We tried that approach with hilarious results:

First, it was moving in the wrong direction, then it was jumping around. Changing the geo projection to achieve zoom and pan was not the answer. Something was amiss.
Turns out in D3v4, the zoom callback gets info to build an SVG transform. A translate() followed by a scale().
Apply those on the visualization and you get working zooming and panning! Of anything :D
// in SVG rendering component
    onZoom() {
        this.setState({
            transform: d3.event.transform
        });
    }

    get transform() {
        if (this.state.transform) {
            const { x, y, k } = this.state.transform;
            return `translate(${x}, ${y}) scale(${k})`;
        }else{
            return null;
        }
    }
    // ...
    render() {
        return (
            <svg width={width} height={height} ref="svg">
                <g transform={this.transform}>
                // ...
    }
</g></svg>
Get d3.event.transform, save it in state or a data store of some sort, re-render, use it on a <g> element that wraps everything.
Voila, zooming and panning. ?

You can see the full World component on Github.
Happy hacking! ?
Continue reading about Livecoding #34: A Map of Global Migrations, Part 3
Semantically similar articles hand-picked by GPT-4
- Livecoding #32: A Map of Global Migrations, Part 1
- Livecoding #33: A Map of Global Migrations, Part 2
- Livecoding #18: An abstract React transition component
- Livecoding #19: It’s hard to package a library
- Livecoding Recap: A new more versatile React pattern
Learned something new?
Read more Software Engineering Lessons from Production
I write articles with real insight into the career and skills of a modern software engineer. "Raw and honest from the heart!" as one reader described them. Fueled by lessons learned over 20 years of building production code for side-projects, small businesses, and hyper growth startups. Both successful and not.
Subscribe below 👇
Software Engineering Lessons from Production
Join Swizec's Newsletter and get insightful emails 💌 on mindsets, tactics, and technical skills for your career. Real lessons from building production software. No bullshit.
"Man, love your simple writing! Yours is the only newsletter I open and only blog that I give a fuck to read & scroll till the end. And wow always take away lessons with me. Inspiring! And very relatable. 👌"
Have a burning question that you think I can answer? Hit me up on twitter and I'll do my best.
Who am I and who do I help? I'm Swizec Teller and I turn coders into engineers with "Raw and honest from the heart!" writing. No bullshit. Real insights into the career and skills of a modern software engineer.
Want to become a true senior engineer? Take ownership, have autonomy, and be a force multiplier on your team. The Senior Engineer Mindset ebook can help 👉 swizec.com/senior-mindset. These are the shifts in mindset that unlocked my career.
Curious about Serverless and the modern backend? Check out Serverless Handbook, for frontend engineers 👉 ServerlessHandbook.dev
Want to Stop copy pasting D3 examples and create data visualizations of your own? Learn how to build scalable dataviz React components your whole team can understand with React for Data Visualization
Want to get my best emails on JavaScript, React, Serverless, Fullstack Web, or Indie Hacking? Check out swizec.com/collections
Did someone amazing share this letter with you? Wonderful! You can sign up for my weekly letters for software engineers on their path to greatness, here: swizec.com/blog
Want to brush up on your modern JavaScript syntax? Check out my interactive cheatsheet: es6cheatsheet.com
By the way, just in case no one has told you it yet today: I love and appreciate you for who you are ❤️

