

StatsD is "A network daemon that runs on the Node.js platform and listens for statistics, like counters and timers, sent over UDP and sends aggregates to one or more pluggable backend services"
I've previously mentioned StatsD in Your startup needs a dashboard over at Zemanta's fruitblog.
The idea behind StatsD is this:
- Stuff happens
- Send metrics of "stuff" to a central service (StatsD)
- StatsD acts as a buffer, forwards aggregated metrics every X seconds
Your architecture now has a central service that collects all of your metrics, then pushes them to appropriate software, that doesn't need to handle too much traffic and is guaranteed data will come from a single source in a sanitized format.

Straight from the browser?
Collecting data into StatsD works wonderfully. It's fast, reliable, extremely robust and you can give it just about any data you can think of.
Unless your client is a browser.
See, StatsD only accepts UDP packets and browsers don't let you send UDP packets. There's a valid excuse for this - it doesn't matter if some packets are lost, as long as whatever you're measuring isn't slowed down by the measuring.
To solve this I created a simple proxy in node.js. It accepts normal HTTP requests and pushes data onward to StatsD. The simplicity, I hope, ensures speed.
The API is a simple tracking pixel:
<img src="http://<address>?t=<type>&v=<value>&b=<bucket>" />
Where type is one of c (counter), t (timer), g (gauge). As per StatsD naming convention. And bucket is simply the name of your metric.
The source is on github. Feel free to use it.
Straight to the browser
Ok, so now we can collect data from the browser ... but I want to send it directly to a browser as well. None of that Graphite stuff - I want to use some other fancy graphs and visualisations. Just because.
To solve this problem I implemented a socket.io backend for StatsD. It, also, can be found on github -> https://github.com/etsy/statsd/pull/102
Hope the pull request gets merged soon, or at all for that matter. I really think this is a useful addition to StatsD because it means you can use whatever client-side javascript to do visualisations. In near real-time and all that.
The data is sent over in a simple format:
{perSecond: {bucket1: 0.2,
             bucket2: 0.1
             },
 counts: {bucket1: 2,
          bucket2: 1
         },
 timers: {timer1: {upper: 2.4,
                   lower: 1.2,
                   count: 10}
         },
 gauges: {gauge1: 10
          },
 statsd: {numStats: 6},
 timestamp: <unix timestamp>}
The goal?
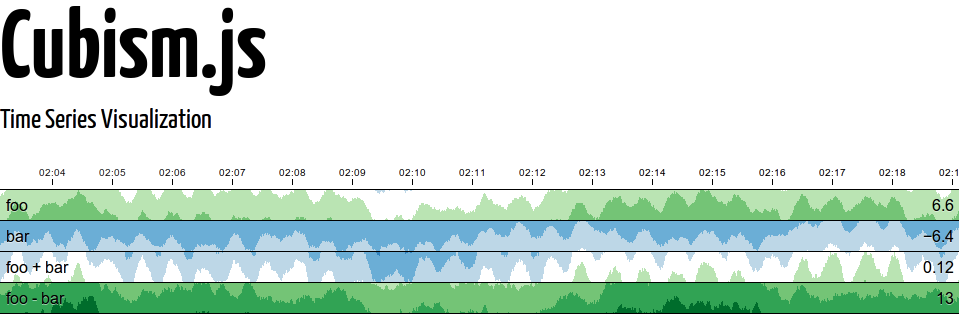
If all goes well, I will soon be able to use cubism.js to draw a pretty timeseries of the traffic on this blog. And hey, who knows what else I can think of to add to a personal dashboard of my life ... I now have the basic framework. Time to start using it.
Continue reading about Making statsd talk directly to a browser
Semantically similar articles hand-picked by GPT-4
- JavaScript’s most popular dataviz library
- (ab)Using d3.js to make a Pong game
- Kids, always remember to clear your intervals
- Logging 1,721,410 events per day with Postgres, Rails, Heroku, and a bit of JavaScript
- Testing socket.io apps
Learned something new?
Read more Software Engineering Lessons from Production
I write articles with real insight into the career and skills of a modern software engineer. "Raw and honest from the heart!" as one reader described them. Fueled by lessons learned over 20 years of building production code for side-projects, small businesses, and hyper growth startups. Both successful and not.
Subscribe below 👇
Software Engineering Lessons from Production
Join Swizec's Newsletter and get insightful emails 💌 on mindsets, tactics, and technical skills for your career. Real lessons from building production software. No bullshit.
"Man, love your simple writing! Yours is the only newsletter I open and only blog that I give a fuck to read & scroll till the end. And wow always take away lessons with me. Inspiring! And very relatable. 👌"

Have a burning question that you think I can answer? Hit me up on twitter and I'll do my best.
Who am I and who do I help? I'm Swizec Teller and I turn coders into engineers with "Raw and honest from the heart!" writing. No bullshit. Real insights into the career and skills of a modern software engineer.
Want to become a true senior engineer? Take ownership, have autonomy, and be a force multiplier on your team. The Senior Engineer Mindset ebook can help 👉 swizec.com/senior-mindset. These are the shifts in mindset that unlocked my career.
Curious about Serverless and the modern backend? Check out Serverless Handbook, for frontend engineers 👉 ServerlessHandbook.dev
Want to Stop copy pasting D3 examples and create data visualizations of your own? Learn how to build scalable dataviz React components your whole team can understand with React for Data Visualization
Want to get my best emails on JavaScript, React, Serverless, Fullstack Web, or Indie Hacking? Check out swizec.com/collections
Did someone amazing share this letter with you? Wonderful! You can sign up for my weekly letters for software engineers on their path to greatness, here: swizec.com/blog
Want to brush up on your modern JavaScript syntax? Check out my interactive cheatsheet: es6cheatsheet.com
By the way, just in case no one has told you it yet today: I love and appreciate you for who you are ❤️