


This is a Livecoding Recap – an almost-weekly post about interesting things discovered while livecoding. Usually shorter than 500 words. Often with pictures. Livecoding happens almost every Sunday at 2pm PDT on multiple channels. You should subscribe to My Youtube channel(https://www.youtube.com/user/theswizec) to catch me live.
Flamegraphs are great. They show you when you've been bad and made the CPU cry.
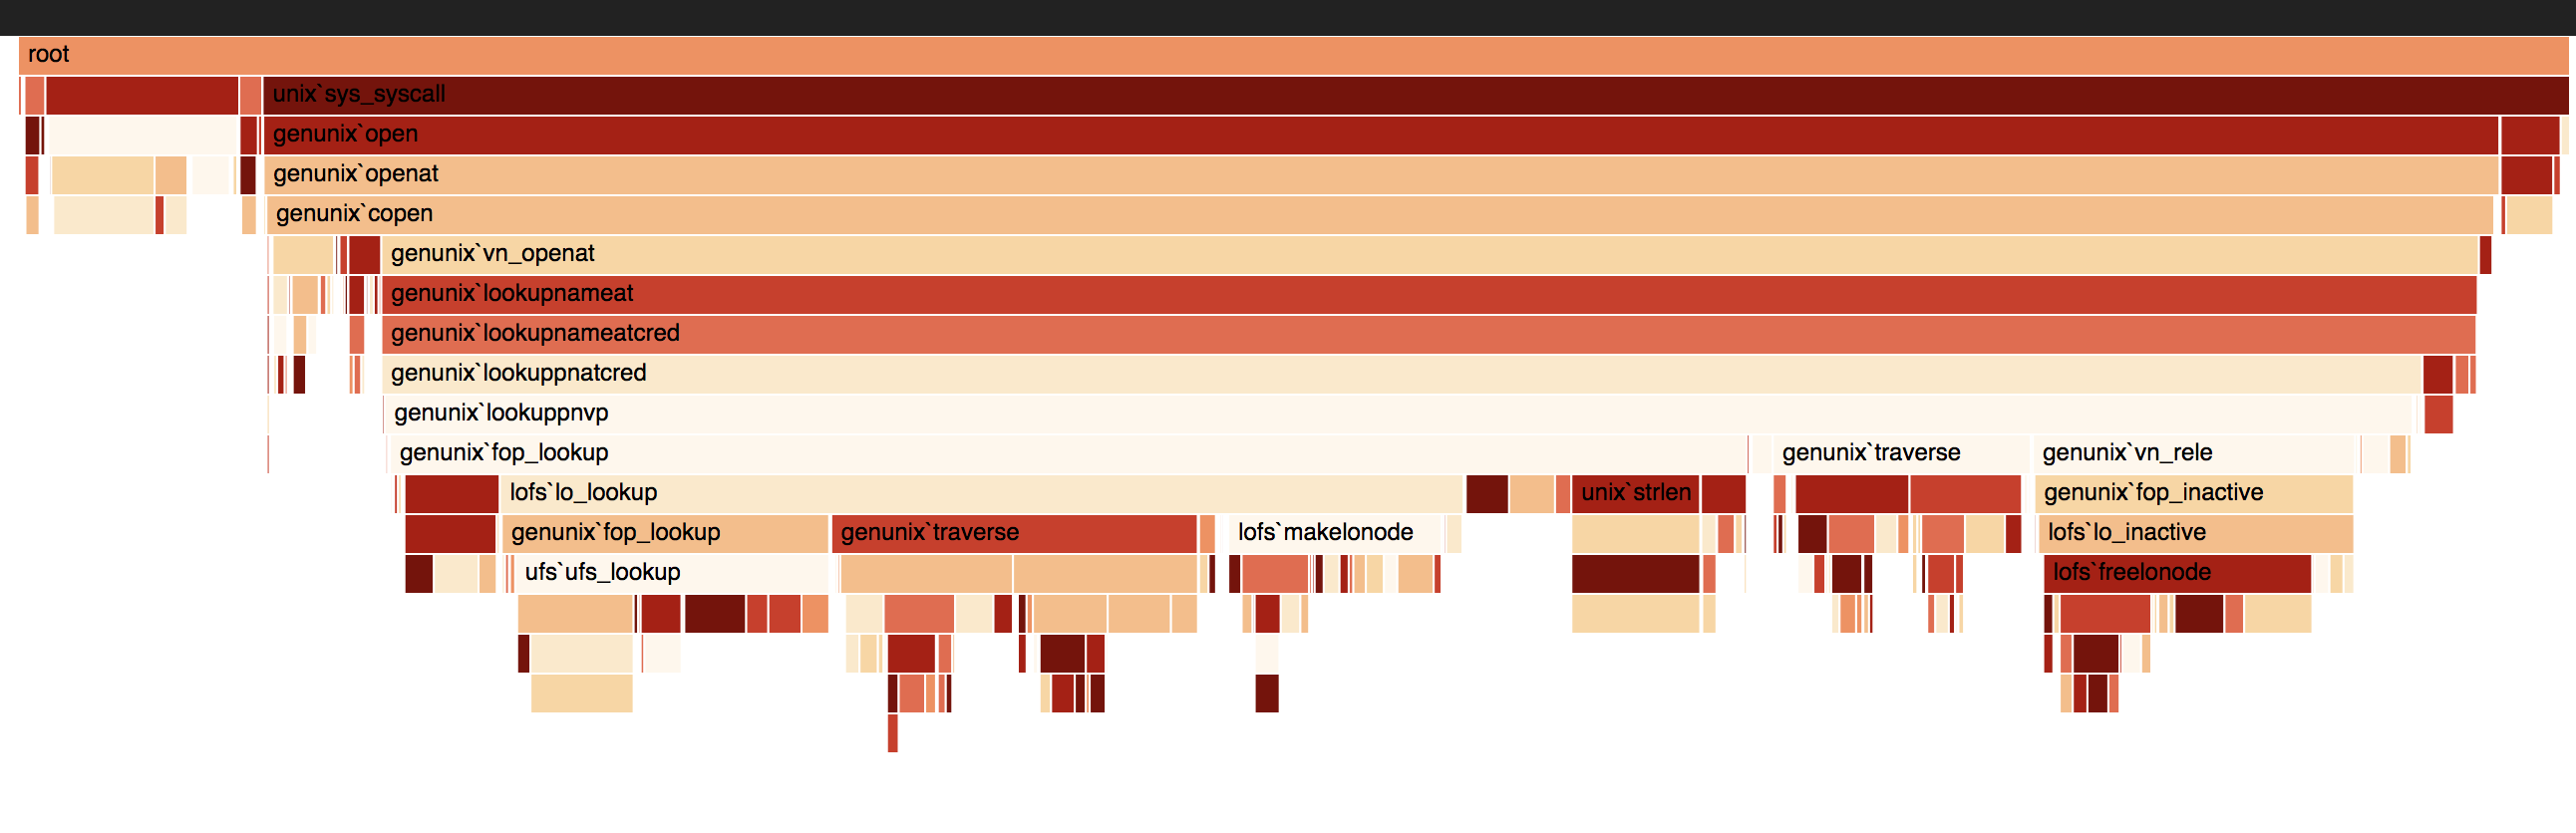
Here is a flamegraph built with React & D3. It shows some stack data I stole from the internet:
This is better. I'm gonna have to spend some time thinking about how to make individual nodes inspectable with a nice animated transition.
— Swizec Teller (@Swizec) June 3, 2018
I assume that would be a useful feature @brian_d_vaughn ? pic.twitter.com/7shyFCxyde
You can try it out here, and see the code on GitHub. Consider it a work in progress. Releasing as open source once the animation works smoothly :)
Here's how it works 👇
You have two components:
<Flamegraph>, which recursively renders the data tree<FlameRect>, which renders a particular rectangle and its label
Flamegraph
The <Flamegraph> component without animation takes your data, loops it through the array of entries at this level, and calls itself on data.children.
import { scaleLinear, schemeOrRd, color as d3color } from "d3";

class Flamegraph extends React.Component {
    render() {
        const { x = 0, y = 0, width, level = 0, data } = this.props;

        const xScale = scaleLinear()
            .domain([0, data.reduce((sum, d) => sum + d.value, 0)])
            .range([0, width]);

        return (
            <g transform="{`translate(${x}," ${y})`}="">
                {data.map((d, i) => {
                    const start = data
                        .slice(0, i)
                        .reduce((sum, d) => sum + d.value, 0);

                    return (
                        <react class="fragment" key={`${level}-${d.name}`}>
                            <flamerect x={xScale(start)} y={0} width={xScale(d.value)} height={RowHeight} name={d.name}>
                            {d.children && (
                                <flamegraph data={d.children} x={xScale(start)} y={RowHeight} width={xScale(d.value)} level="{level" +="" 1}="">
                            )}
                        </flamegraph></flamerect></react>
                    );
                })}
            </g>
        );
    }
}
Our render method takes a bunch of params out of props, creates a linear D3 scale to make calculations easier, then renders an SVG grouping element.
Inside that element, we loop through the data, and for each entry, we create a new <React.Fragment>. The fragment contains <FlameRect> which represents the current datapoint, and a <Flamegraph> which renders all the child nodes.
We decide each element's x position based on the sum of all node values up to the current one. And we make sure the child <Flamegraph> uses the same width as the current node. This creates the neat stacking effect.
The <FlameRect> component takes care of choosing a random color on initial render, highlighting when clicked, and displaying a label if there's enough space.
It looks like this:
import { scaleLinear, schemeOrRd, color as d3color } from "d3";

class FlameRect extends React.Component {
    state = {
        hideLabel: false,
        selected: false,
        color: schemeOrRd[9][Math.floor(Math.random() * 9)]
    };

    labelRefCallback = element => {
        if (
            element &&
            element.getBoundingClientRect().width > this.props.width
        ) {
            this.setState({
                hideLabel: true
            });
        }
    };

    onClick = () => this.setState({ selected: !this.state.selected });

    render() {
        const { x, y, width, height, name } = this.props,
            { hideLabel, selected } = this.state;
        let { color } = this.state;

        if (selected) {
            color = d3color(color).brighter();
        }

        return (
            <g transform="{`translate(${x}," ${y})`}="" style={{ cursor: "pointer" }} onclick={this.onClick}>
                <rect x={0} y={0} width={width} height={height} style={{ stroke: "white", fill: color }}>
                {!hideLabel && (
                    <text x={5} y={13} style={{ fontsize: "12px" }} ref={this.labelRefCallback}>
                        {name}
                    </text>
                )}
            </rect></g>
        );
    }
}
We render a grouping element that contains a <rect> and a <text>. The rect gets sizing and color information, and the label gets a ref callback and some text.
We use the ref callback to dynamically detect the size of our label and hide it if necessary. That happens in labelRefCallback.
onClick, we flip the selected state.
And well, that's it. You can think of this component as a basic toggle component. Uses all the same logic, just renders as a colorful rectangle instead of a button.
Fin
That's the basic <Flamegraph> component. Uses recursion to render a tree data structure and lets you highlight individual elements.
Where it gets tricky is adding animation that lets users explore their data. Turns out deeply nested React elements are hard to animate smoothly.
Smoothly animating recursive structures is hard. @brian_d_vaughn might not get the flamegraph shininess I half promised@sxywu @micahstubbs any tips? pic.twitter.com/2ARgb3izCq
— Swizec Teller (@Swizec) June 5, 2018
The worst part is how long it takes before React even propagates prop updates through the tree before the animation even starts. Once the animation is running, it's smooth as silk.
But getting it started, ho boy.
This warrants further research. I'll be back :)
PS: version 0.1.0 is in fact on npm if you want to play.
Continue reading about Tiny React & D3 flamegraph tutorial
Semantically similar articles hand-picked by GPT-4
- Livecoding Recap: A new more versatile React pattern
- Livecoding #19: It’s hard to package a library
- Livecoding #12: towards animating 10k+ elements with React
- Livecoding #21: Use Babel for libraries, not Webpack
- Livecoding #34: A Map of Global Migrations, Part 3
Learned something new?
Read more Software Engineering Lessons from Production
I write articles with real insight into the career and skills of a modern software engineer. "Raw and honest from the heart!" as one reader described them. Fueled by lessons learned over 20 years of building production code for side-projects, small businesses, and hyper growth startups. Both successful and not.
Subscribe below 👇
Software Engineering Lessons from Production
Join Swizec's Newsletter and get insightful emails 💌 on mindsets, tactics, and technical skills for your career. Real lessons from building production software. No bullshit.
"Man, love your simple writing! Yours is the only newsletter I open and only blog that I give a fuck to read & scroll till the end. And wow always take away lessons with me. Inspiring! And very relatable. 👌"

Have a burning question that you think I can answer? Hit me up on twitter and I'll do my best.
Who am I and who do I help? I'm Swizec Teller and I turn coders into engineers with "Raw and honest from the heart!" writing. No bullshit. Real insights into the career and skills of a modern software engineer.
Want to become a true senior engineer? Take ownership, have autonomy, and be a force multiplier on your team. The Senior Engineer Mindset ebook can help 👉 swizec.com/senior-mindset. These are the shifts in mindset that unlocked my career.
Curious about Serverless and the modern backend? Check out Serverless Handbook, for frontend engineers 👉 ServerlessHandbook.dev
Want to Stop copy pasting D3 examples and create data visualizations of your own? Learn how to build scalable dataviz React components your whole team can understand with React for Data Visualization
Want to get my best emails on JavaScript, React, Serverless, Fullstack Web, or Indie Hacking? Check out swizec.com/collections
Did someone amazing share this letter with you? Wonderful! You can sign up for my weekly letters for software engineers on their path to greatness, here: swizec.com/blog
Want to brush up on your modern JavaScript syntax? Check out my interactive cheatsheet: es6cheatsheet.com
By the way, just in case no one has told you it yet today: I love and appreciate you for who you are ❤️