How to Make a Piechart using React and d3
Hi 👋 you're reading a pretty old post! I started writing on here back in high school and this page may not reflect my current views. Recommend checking out related articles and categories down below, I've likely published more recent thoughts on this topic.
Piecharts might be the single most mocked chart in the world, but they’re great. Is there a better way to show proportions?
Of course, it all breaks down when you have more than a couple data points. And yes, it’s impossible to gauge the difference between 24% and 26% on a piechart. Not to mention the accessibility issues when the charts rely on colors to distinguish slices.
If you google "never use a piechart”, 597,000 results show up. That’s a bunch of hate for the poor piechart.
But they’re easy and fun to make. They’re perfect for showing overwhelming proportions, and there’s nothing like a piechart to make an enterprise presentation more enterprisey.
Especially if you make it 3D.
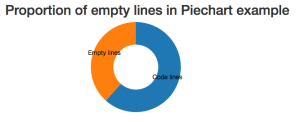
When I say that a piechart is easy to make, I mean that with 86 lines of very beautiful and readable code, you can make one that looks great. 86 lines might sound like a lot for a piechart, but 33 of those are empty lines or closing braces. That’s 38%.
Let me show you with a piechart :)
See, piecharts work. To build this, we’re going to:
- use a d3 layout to calculate a piechart
- use React stuff to render the piechart
- build a generic Piechart component
At the end of this tutorial, you’ll have piechart component that you can use like this:
<piechart x={100} y={100} outerradius={100} innerradius={50} data="{[{value:" 92-34,="" label:="" 'code="" lines'},="" {value:="" 34,="" 'empty="" lines'}]}="">

</piechart>
Pretty great, huh?
We’re going to build 3 components:
Piechart- the piechart itselfArc- each of the slicesLabeledArc- a slice with some text
Piechart
This is the piechart’s main component. It takes data and draws the arcs. That’s all it does.
The component skeleton for Piechart looks like this:
// ./src/components/Piechart/index.jsx

import React, { Component } from "react";

import { LabeledArc } from "./Arc";

class Piechart extends Component {
  constructor() {}

  arcGenerator(d, i) {}

  render() {}
}

export default Piechart;
We start by importing react and the LabeledArc component, which we’ll use for the arcs. The constructor is going to initialize d3’s pie layout, the arcGenerator is a helper function that makes our code easier to read, and render takes care of rendering.
Yes, this is a simple component. As such, it doesn’t really need to be a class. It could be a functional stateless component, but the code looks messier to me.
I’ll show you the functional version later, and you can decide for yourself.
Now, the Piechart’s constructor looks like this:
// ./src/components/Piechart/index.jsx
class Piechart extends Component {
    constructor() {
        super();

        this.pie = d3.layout.pie()
                     .value((d) => d.value);
        this.colors = d3.scale.category10();
    }
We use super() to call the parent constructor, then initialize a pie layout with a basic value accessor. That tells it how to get values from our data.
Of course, we could avoid this step and re-initialize a new pie layout on every render, but that seems wasteful.
The layout is what turns the data into a piechart, by the way. It takes an array of values and returns an array of data in exactly the format that d3’s arc generator expects.
It’s great. You’ll see.
We also initialize a color scale. We’ll use it to give different colors to piechart slices.
The next function we need is arcGenerator. This function returns a LabeledArc component with some props filled in. We could put this code in the iterator inside render(), but doing it that way gets messy and makes our code harder to read.
// ./src/components/Piechart/index.jsx
arcGenerator(d, i) {
        return (
            <labeledarc key={`arc-${i}`} data={d} innerradius={this.props.innerRadius} outerradius={this.props.outerRadius} color={this.colors(i)}>
        );
    }
</labeledarc>
We define a key because React yells at us otherwise. We use the current data points data, pass innerRadius and outerRadius from Piechart’s own props, and use the color scale to get a color.
Now for the render function:
// ./src/components/Piechart/index.jsx
    render() {
        let pie = this.pie(this.props.data),
            translate = `translate(${this.props.x}, ${this.props.y})`;

        return (
            <g transform={translate}>
                {pie.map((d, i) => this.arcGenerator(d, i))}
            </g>
        )
    }
We use the data to generate a piechart with this.pie, set up a translation to move our piechart into desired position, then return a grouping element with a bunch of arcs.
That’s it. Our piechart shows up on the screen.
Or, well, an error shows up because LabeledArc doesn’t exist yet. But once we make that, a piechart is going to show up on screen.
Here’s the same code as a functional stateless component. This snippet is 12 lines shorter, but I’m not sure it’s better, per se. It reinitializes both the pie layout and the colors scale on each render, and it awkwardly embeds LabeledArc in the iterator.
const Piechart = ({x, y, innerRadius, outerRadius, data}) => {
    let pie = d3.layout.pie()
                .value((d) => d.value)(data),
        translate = `translate(${x}, ${y})`,
        colors = d3.scale.category10();

    return (
        <g transform={translate}>
            {pie.map((d, i) => (
                <labeledarc key={`arc-${i}`} data={d} innerradius={innerRadius} outerradius={outerRadius} color={colors(i)}>))}
        </labeledarc></g>
    );
};
Use the approach you prefer. In this case, they both work essentially the same way.
Arc
Ok, we’ve got the basic Piechart. It tries to draw arcs, but the component for them doesn’t exist yet.
When you think about it, a LabeledArc is a type of Arc. It’s a component that draws a pie slice and a label. So it makes sense to build an Arc component first, then subclass it with LabeledArc and add some features.
With ES6 classes, we can do that without funky JavaScript magic. Sure, Babel compiles it to weird funky magic, but we don’t have to worry about it.
The base Arc class looks like this:
// ./src/components/Piechart/index.jsx
import React, { Component } from "react";
import d3 from "d3";

class Arc extends Component {
  constructor() {
    super();
  }

  componentWillMount() {
    this.updateD3(this.props);
  }

  componentWillReceiveProps(newProps) {
    this.updateD3(newProps);
  }

  updateD3(newProps) {}

  render() {}
}

export default Arc;
We start by importing React and d3. Then, we define an Arc class which extends Component. In this case, we can’t use functional stateless components for two reasons:
- We need component lifecycle functions to update the internal state of our arc generator. I’ll show you that in a bit.
- You can’t extend a function. We could play with functional composition, but in my experience, that sort of code, in JavaScript at least, is hard to read 2 months later. And it causes interesting issues when debugging.
The Arc component has four methods: the constructor, the lifecycle hooks to call updateD3, the method that updates d3 internals’ state, and the render method.
All the constructor has to do is instantiate a new d3.svg.arc generator. That looks like this:
// ./src/components/Piechart/index.jsx
class Arc extends Component {
    constructor() {
        super();

        this.arc = d3.svg.arc();
    }
We now have an instance of the arc generator, and we’re going to update its internals in updateD3. If we wanted to set up some arc defaults or constants, this would be a good place.
If you aren’t familiar with arc generators, they’re these funny d3.js things that create SVG path definitions. For instance, the “Empty lines” path definition in that screenshot you saw earlier looks like this:
M-66.73188112222397,74.47721827437816A100,100 0 0,1 -1.8369701987210297e-14,-100L-9.184850993605149e-15,-50A50,50 0 0,0 -33.365940561111984,37.23860913718908Z.
You can define any shape in the world with an SVG path definition like that. But it’s not something you ever want to write by hand. Ever. Or even think about, really.
So, when you want an arc, use d3.svg.arc() :)
The updateD3 method looks like this:
// ./src/components/Piechart/index.jsx
    componentWillMount() {
        this.updateD3(this.props);
    }

    componentWillReceiveProps(newProps) {
        this.updateD3(newProps);
    }

    updateD3(newProps) {
        this.arc.innerRadius(newProps.innerRadius);
        this.arc.outerRadius(newProps.outerRadius);
    }
Can you guess what happens here? We update our arc’s inner and outer radius. This lets the users of our component define how big they want arcs to be.
Because d3 objects have internal state, we have to make sure to update them every time our props might have changed – componentWillMount and componentWillReceiveProps.
And yes, you’re right. We could reinitialize the arc on every render. And I still think that feels wasteful and unnecessary.
Now for the render method. It looks like this:
// ./src/components/Piechart/index.jsx
    render() {
        return (
            <path d={this.arc(this.props.data)} style="{{fill:" this.props.color}}=""></path>
        );
    }
As I hinted earlier, we render an SVG path element. The shape definition – d – comes from this.arc and some data, and the color comes from this.props.color.
You can render a piechart now. Wonderful, isn’t it? :)
LabeledArc
Piecharts stand on shaky ground as it is. Almost everybody who’s into dataviz hates them. Almost everybody who’s into business intelligence loves them.
Both groups hate unlabeled piecharts, though. Let’s take care of that.
To add labels, we’re going to build a LabeledArc component that subclasses Arc. It’s what classes are for, right?
Now, even though this component is a fancy render function, we cannot make it a functional stateless component. We need a reference to the arc generator when calculating coordinates for the label.
Let me show you. LabeledArc looks like this:
// ./src/components/Piechart/index.jsx
class LabeledArc extends Arc {
  render() {
    let [labelX, labelY] = this.arc.centroid(this.props.data),
      labelTranslate = `translate(${labelX}, ${labelY})`;

    return (
      <g>
        {super.render()}
        <text transform={labelTranslate} textanchor="middle">
          {this.props.data.data.label}
        </text>
      </g>
    );
  }
}

export { LabeledArc };
We calculate labelX and labelY with this.arc.centroid(data). This gives us the center point of an arc. I don’t know how the math works. All I know is that it works and that I’m happy somebody made it for me.
Notice how we can use this.arc as if it was defined inside LabeledArc. Subclassing is great like that. Don’t go overboard and become an architecture astronaut.
Next, we put these coordinates into the usual SVG translate transformation and render a grouping element with an arc and a label. We get the arc itself with super.render(), which calls the parent render function, and the label as a text element.
I know using this.props.data.data.label to get the text looks weird, but that’s how it works. this.props.data is a single datapoint in the entire piechart, its .data property is where d3’s pie layout puts original data, and .label is how our base data defined labels. It works.
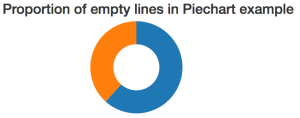
Our piechart’s code profile piechart looks like this:
Wonderful.
Voilà
You now have a generic piechart component that you can copy-pasta around your codebase whenever you want.
Need a piechart? Use <Piechart> and give it some props. The component has you covered.
To recap, here’s what we learned:
- Piecharts are okay, but not great, dataviz
- A Piechart takes 53 lines of real code to make
- 41 lines with some boilerplate reduction
- A Piechart is made up of 3 components: Piechart, Arc, LabeledArc
- D3 makes the hard maths trivial
- ES6 classes and subclassing are great
You can learn more about using React and d3js together in my new book, React+d3js ES6, here.
Filed under: d3jsFront Endreactreact+d3jsreactjsTechnical